- Matplotlib Basics
- Matplotlib - Home
- Matplotlib - Introduction
- Matplotlib - Vs Seaborn
- Matplotlib - Environment Setup
- Matplotlib - Anaconda distribution
- Matplotlib - Jupyter Notebook
- Matplotlib - Pyplot API
- Matplotlib - Simple Plot
- Matplotlib - Saving Figures
- Matplotlib - Markers
- Matplotlib - Figures
- Matplotlib - Styles
- Matplotlib - Legends
- Matplotlib - Colors
- Matplotlib - Colormaps
- Matplotlib - Colormap Normalization
- Matplotlib - Choosing Colormaps
- Matplotlib - Colorbars
- Matplotlib - Text
- Matplotlib - Text properties
- Matplotlib - Subplot Titles
- Matplotlib - Images
- Matplotlib - Image Masking
- Matplotlib - Annotations
- Matplotlib - Arrows
- Matplotlib - Fonts
- Matplotlib - What are Fonts?
- Setting Font Properties Globally
- Matplotlib - Font Indexing
- Matplotlib - Font Properties
- Matplotlib - Scales
- Matplotlib - Linear and Logarthmic Scales
- Matplotlib - Symmetrical Logarithmic and Logit Scales
- Matplotlib - LaTeX
- Matplotlib - What is LaTeX?
- Matplotlib - LaTeX for Mathematical Expressions
- Matplotlib - LaTeX Text Formatting in Annotations
- Matplotlib - PostScript
- Enabling LaTex Rendering in Annotations
- Matplotlib - Mathematical Expressions
- Matplotlib - Animations
- Matplotlib - Artists
- Matplotlib - Styling with Cycler
- Matplotlib - Paths
- Matplotlib - Path Effects
- Matplotlib - Transforms
- Matplotlib - Ticks and Tick Labels
- Matplotlib - Radian Ticks
- Matplotlib - Dateticks
- Matplotlib - Tick Formatters
- Matplotlib - Tick Locators
- Matplotlib - Basic Units
- Matplotlib - Autoscaling
- Matplotlib - Reverse Axes
- Matplotlib - Logarithmic Axes
- Matplotlib - Symlog
- Matplotlib - Unit Handling
- Matplotlib - Ellipse with Units
- Matplotlib - Spines
- Matplotlib - Axis Ranges
- Matplotlib - Axis Scales
- Matplotlib - Axis Ticks
- Matplotlib - Formatting Axes
- Matplotlib - Axes Class
- Matplotlib - Twin Axes
- Matplotlib - Figure Class
- Matplotlib - Multiplots
- Matplotlib - Grids
- Matplotlib - Object-oriented Interface
- Matplotlib - PyLab module
- Matplotlib - Subplots() Function
- Matplotlib - Subplot2grid() Function
- Matplotlib - Anchored Artists
- Matplotlib - Manual Contour
- Matplotlib - Coords Report
- Matplotlib - AGG filter
- Matplotlib - Ribbon Box
- Matplotlib - Fill Spiral
- Matplotlib - Findobj Demo
- Matplotlib - Hyperlinks
- Matplotlib - Image Thumbnail
- Matplotlib - Plotting with Keywords
- Matplotlib - Create Logo
- Matplotlib - Multipage PDF
- Matplotlib - Multiprocessing
- Matplotlib - Print Stdout
- Matplotlib - Compound Path
- Matplotlib - Sankey Class
- Matplotlib - MRI with EEG
- Matplotlib - Stylesheets
- Matplotlib - Background Colors
- Matplotlib - Basemap
- Matplotlib Event Handling
- Matplotlib - Event Handling
- Matplotlib - Close Event
- Matplotlib - Mouse Move
- Matplotlib - Click Events
- Matplotlib - Scroll Event
- Matplotlib - Keypress Event
- Matplotlib - Pick Event
- Matplotlib - Looking Glass
- Matplotlib - Path Editor
- Matplotlib - Poly Editor
- Matplotlib - Timers
- Matplotlib - Viewlims
- Matplotlib - Zoom Window
- Matplotlib Plotting
- Matplotlib - Bar Graphs
- Matplotlib - Histogram
- Matplotlib - Pie Chart
- Matplotlib - Scatter Plot
- Matplotlib - Box Plot
- Matplotlib - Violin Plot
- Matplotlib - Contour Plot
- Matplotlib - 3D Plotting
- Matplotlib - 3D Contours
- Matplotlib - 3D Wireframe Plot
- Matplotlib - 3D Surface Plot
- Matplotlib - Quiver Plot
- Matplotlib Useful Resources
- Matplotlib - Quick Guide
- Matplotlib - Useful Resources
- Matplotlib - Discussion
Matplotlib - Annotations
In Matplotlib library annotations refer to the capability of adding text or markers to specific locations on a plot to provide additional information or highlight particular features. Annotations allow users to label data points and indicate trends or add descriptions to different parts of a plot.
Key Aspects of Annotations in Matplotlib
The following are the key aspects of annotations in matplotlib library.
Text Annotations
Text annotations in data visualization are used to add explanatory or descriptive text to specific points, regions, or features within a plot. Annotations help in highlighting important information, providing context, or explaining trends and patterns within the visualized data.
Marker Annotations
Marker annotations in data visualization typically involve placing markers or symbols on specific points of interest within a plot to highlight or provide additional information about those points. These annotations can be textual or graphical and are commonly used to draw attention to significant data points, peaks, valleys, outliers or any crucial information in a visual representation.
Callouts
Callouts in data visualization refer to a specific type of annotation that uses visual elements like arrows, lines, or text to draw attention to a particular area or feature within a plot. They are often used to provide additional context or explanations about specific data points or regions of interest.
The plt.annotate() function in Matplotlib library is used to add an annotation to a plot. It allows us to place a text annotation with optional arrows pointing to specific data points on the plot.
Syntax
The following is the syntax for the plt.annotate() function.
plt.annotate(text, xy, xytext=None, xycoords='data', textcoords='data', arrowprops=None, annotation_clip=None, kwargs)
Where,
text (str) − The text of the annotation.
xy (tuple or array) − The point (x, y) to annotate.
xytext (tuple or array, optional) − The position (x, y) to place the text. If None defaults to `xy`.
xycoords (str, Artist, or Transform, optional) − The coordinate system that `xy` is given in. Default is 'data'.
textcoords (str, Artist, or Transform, optional) − The coordinate system that `xytext` is given in. Default is 'data'.
arrowprops (dict, optional) − A dictionary of arrow properties. If not None an arrow is drawn from the annotation to the text.
annotation_clip (bool or None, optional) − If True the text will only be drawn when the annotation point is within the axes. If None it will take the value from rcParams["text.clip"].
kwargs (optional) − Additional keyword arguments that are passed to Text.
Adding the annotation to the plot
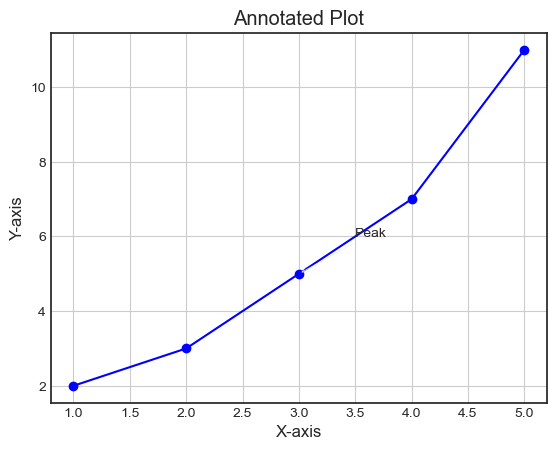
In this example we are using the plt.annotate() function to add an annotation with the text 'Peak' at the point (3, 5) on the plot.
Example
import matplotlib.pyplot as plt
# Plotting data
x = [1, 2, 3, 4, 5]
y = [2, 3, 5, 7, 11]
plt.plot(x, y, marker='o', linestyle='-', color='blue')

# Adding annotation
plt.annotate('Peak', xy=(3, 5), xytext=(3.5, 6), arrowprops=dict(facecolor='black', arrowstyle='->'), fontsize=10)
plt.xlabel('X-axis')
plt.ylabel('Y-axis')
plt.title('Annotated Plot')
plt.grid(True)
plt.show()
Output
Example
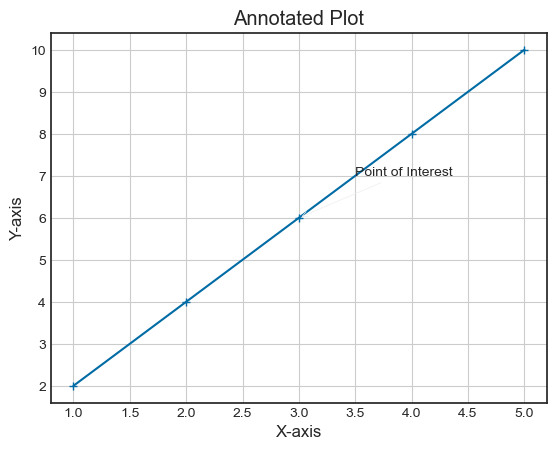
Here this is another example of using the ‘plt.annotations’ function for adding the annotation to the image.
import matplotlib.pyplot as plt
# Sample data
x = [1, 2, 3, 4, 5]
y = [2, 4, 6, 8, 10]

# Plotting data
plt.plot(x, y, marker='+', linestyle='-')

# Adding an annotation
plt.annotate('Point of Interest', xy=(3, 6), xytext=(3.5, 7), arrowprops=dict(facecolor='black', arrowstyle='->'))
plt.xlabel('X-axis')
plt.ylabel('Y-axis')
plt.title('Annotated Plot')
plt.grid(True)
plt.show()
Output
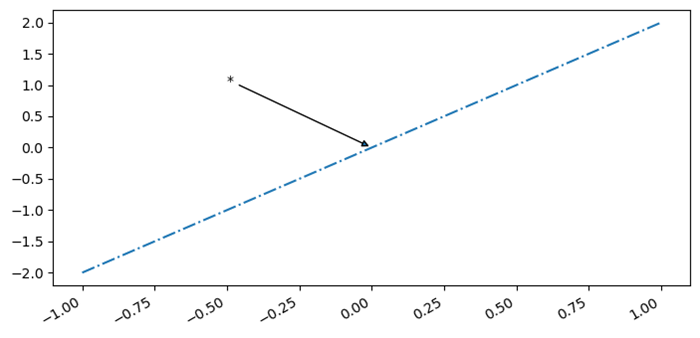
Insert statistical annotations (stars or p-values)
In this example we are inserting the statistical annotations as stars r p-values.
Example
import numpy as np
from matplotlib import pyplot as plt
plt.rcParams["figure.figsize"] = [7.00, 3.50]
plt.rcParams["figure.autolayout"] = True
x = np.linspace(-1, 1, 5)
y = np.linspace(-2, 2, 5)
mean_x = np.mean(x)
mean_y = np.mean(y)
fig, ax = plt.subplots()
ax.plot(x, y, linestyle='-.')
ax.annotate('*', (mean_y, mean_y), xytext=(-.50, 1), arrowprops=dict(arrowstyle='-|>'))
fig.autofmt_xdate()
plt.show()
Output
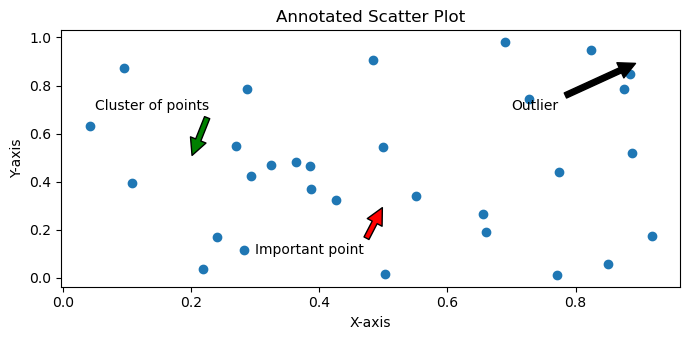
Annotate Matplotlib Scatter Plots
Here in this example we are adding the annotations to the scatter plot that we have plotted.
Example
# Import necessary libraries
import matplotlib.pyplot as plt
import numpy as np

# Create data points to be plotted
x = np.random.rand(30)
y = np.random.rand(30)

# Define the scatter plot using Matplotlib
fig, ax = plt.subplots()
ax.scatter(x, y)

# Add annotations to specific data points using text or arrow annotations
ax.annotate('Outlier', xy=(0.9, 0.9), xytext=(0.7, 0.7),arrowprops=dict(facecolor='black', shrink=0.05))
ax.annotate('Important point', xy=(0.5, 0.3), xytext=(0.3, 0.1),arrowprops=dict(facecolor='red', shrink=0.05))
ax.annotate('Cluster of points', xy=(0.2, 0.5), xytext=(0.05, 0.7),arrowprops=dict(facecolor='green', shrink=0.05))

# Adjust the annotation formatting as needed
plt.title('Annotated Scatter Plot')
plt.xlabel('X-axis')
plt.ylabel('Y-axis')

# Show the scatter plot with annotations
plt.show()
Output
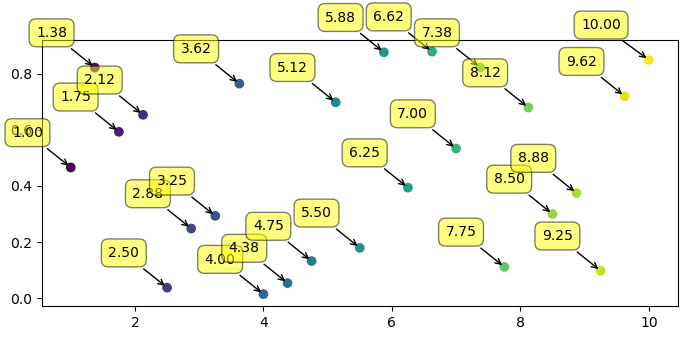
Annotate the points on a scatter plot with automatically placed arrows
In this example we are annotating the point on a scatter plot with automatically placed arrows.
Example
import numpy as np
from matplotlib import pyplot as plt
plt.rcParams["figure.figsize"] = [7.00, 3.50]
plt.rcParams["figure.autolayout"] = True
xpoints = np.linspace(1, 10, 25)
ypoints = np.random.rand(25)
labels = ["%.2f" % i for i in xpoints]
plt.scatter(xpoints, ypoints, c=xpoints)
for label, x, y in zip(labels, xpoints, ypoints):
   plt.annotate(
      label,
      xy=(x, y), xytext=(-20, 20),
      textcoords='offset points', ha='right', va='bottom',
      bbox=dict(boxstyle='round,pad=0.5', fc='yellow', alpha=0.5),
      arrowprops=dict(arrowstyle='->', connectionstyle='arc3,rad=0')
   )
plt.show()
Output
To Continue Learning Please Login