- Matplotlib Basics
- Matplotlib - Home
- Matplotlib - Introduction
- Matplotlib - Vs Seaborn
- Matplotlib - Environment Setup
- Matplotlib - Anaconda distribution
- Matplotlib - Jupyter Notebook
- Matplotlib - Pyplot API
- Matplotlib - Simple Plot
- Matplotlib - Saving Figures
- Matplotlib - Markers
- Matplotlib - Figures
- Matplotlib - Styles
- Matplotlib - Legends
- Matplotlib - Colors
- Matplotlib - Colormaps
- Matplotlib - Colormap Normalization
- Matplotlib - Choosing Colormaps
- Matplotlib - Colorbars
- Matplotlib - Text
- Matplotlib - Text properties
- Matplotlib - Subplot Titles
- Matplotlib - Images
- Matplotlib - Image Masking
- Matplotlib - Annotations
- Matplotlib - Arrows
- Matplotlib - Fonts
- Matplotlib - What are Fonts?
- Setting Font Properties Globally
- Matplotlib - Font Indexing
- Matplotlib - Font Properties
- Matplotlib - Scales
- Matplotlib - Linear and Logarthmic Scales
- Matplotlib - Symmetrical Logarithmic and Logit Scales
- Matplotlib - LaTeX
- Matplotlib - What is LaTeX?
- Matplotlib - LaTeX for Mathematical Expressions
- Matplotlib - LaTeX Text Formatting in Annotations
- Matplotlib - PostScript
- Enabling LaTex Rendering in Annotations
- Matplotlib - Mathematical Expressions
- Matplotlib - Animations
- Matplotlib - Artists
- Matplotlib - Styling with Cycler
- Matplotlib - Paths
- Matplotlib - Path Effects
- Matplotlib - Transforms
- Matplotlib - Ticks and Tick Labels
- Matplotlib - Radian Ticks
- Matplotlib - Dateticks
- Matplotlib - Tick Formatters
- Matplotlib - Tick Locators
- Matplotlib - Basic Units
- Matplotlib - Autoscaling
- Matplotlib - Reverse Axes
- Matplotlib - Logarithmic Axes
- Matplotlib - Symlog
- Matplotlib - Unit Handling
- Matplotlib - Ellipse with Units
- Matplotlib - Spines
- Matplotlib - Axis Ranges
- Matplotlib - Axis Scales
- Matplotlib - Axis Ticks
- Matplotlib - Formatting Axes
- Matplotlib - Axes Class
- Matplotlib - Twin Axes
- Matplotlib - Figure Class
- Matplotlib - Multiplots
- Matplotlib - Grids
- Matplotlib - Object-oriented Interface
- Matplotlib - PyLab module
- Matplotlib - Subplots() Function
- Matplotlib - Subplot2grid() Function
- Matplotlib - Anchored Artists
- Matplotlib - Manual Contour
- Matplotlib - Coords Report
- Matplotlib - AGG filter
- Matplotlib - Ribbon Box
- Matplotlib - Fill Spiral
- Matplotlib - Findobj Demo
- Matplotlib - Hyperlinks
- Matplotlib - Image Thumbnail
- Matplotlib - Plotting with Keywords
- Matplotlib - Create Logo
- Matplotlib - Multipage PDF
- Matplotlib - Multiprocessing
- Matplotlib - Print Stdout
- Matplotlib - Compound Path
- Matplotlib - Sankey Class
- Matplotlib - MRI with EEG
- Matplotlib - Stylesheets
- Matplotlib - Background Colors
- Matplotlib - Basemap
- Matplotlib Event Handling
- Matplotlib - Event Handling
- Matplotlib - Close Event
- Matplotlib - Mouse Move
- Matplotlib - Click Events
- Matplotlib - Scroll Event
- Matplotlib - Keypress Event
- Matplotlib - Pick Event
- Matplotlib - Looking Glass
- Matplotlib - Path Editor
- Matplotlib - Poly Editor
- Matplotlib - Timers
- Matplotlib - Viewlims
- Matplotlib - Zoom Window
- Matplotlib Plotting
- Matplotlib - Bar Graphs
- Matplotlib - Histogram
- Matplotlib - Pie Chart
- Matplotlib - Scatter Plot
- Matplotlib - Box Plot
- Matplotlib - Violin Plot
- Matplotlib - Contour Plot
- Matplotlib - 3D Plotting
- Matplotlib - 3D Contours
- Matplotlib - 3D Wireframe Plot
- Matplotlib - 3D Surface Plot
- Matplotlib - Quiver Plot
- Matplotlib Useful Resources
- Matplotlib - Quick Guide
- Matplotlib - Useful Resources
- Matplotlib - Discussion
Matplotlib - Zoom Window
Zooming a window in data visualizations/plotings refers to the process of adjusting the view to make specific objects or regions larger or smaller. This interactive feature is particularly useful when exploring graphs, charts, or any visual representation, allowing users to focus on specific areas of interest or get a comprehensive view of the entire content.
Zoom Window in Matplotlib
One of the key features of Matplotlib is its support for event handling, which allows users to connect events such as mouse clicks to specific actions in the plot. In this tutorial, we will explore the Zoom Window Event Handling in Matplotlib with a focus on the button_press_event and how it can be used to create zoomable windows.
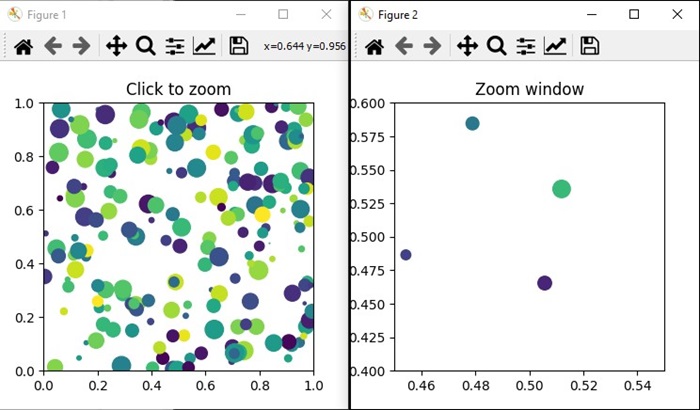
Example 1
This example creates two figures (source and Zoom). The source figure displays a scatter plot, and the zoom figure displays an initial zoomed-in view. When a point is clicked in the source figure, the on_press function is triggered by using the button_press_event. This on_press function adjusts the limits of the zoomable figure to create a zoom effect centered at the clicked point.
import matplotlib.pyplot as plt
import numpy as np

# Fixing random state for reproducibility
np.random.seed(19601)

# Create source and zoomable figures and axes
figsrc, axsrc = plt.subplots(figsize=(3.7, 3.7))
figzoom, axzoom = plt.subplots(figsize=(3.7, 3.7))

# Set initial limits and titles for both axes
axsrc.set(xlim=(0, 1), ylim=(0, 1), autoscale_on=False, title='Click to zoom')
axzoom.set(xlim=(0.45, 0.55), ylim=(0.4, 0.6), autoscale_on=False, title='Zoom window')

# Generate random data for scatter plots
x, y, s, c = np.random.rand(4, 100)
s *= 200

# Plot the scatter plots on both axes
axsrc.scatter(x, y, s, c)
axzoom.scatter(x, y, s, c)

# Define the event handling function
def on_press(event):
   if event.button != 1:
      return
   x, y = event.xdata, event.ydata
   axzoom.set_xlim(x - 0.1, x + 0.1)
   axzoom.set_ylim(y - 0.1, y + 0.1)
   figzoom.canvas.draw()

# Connect the event handler to the source figure
figsrc.canvas.mpl_connect('button_press_event', on_press)

# Show the plots
plt.show()
Output
On executing the above program you will get the following output −
Watch the video below to observe how the zoom window feature works here.
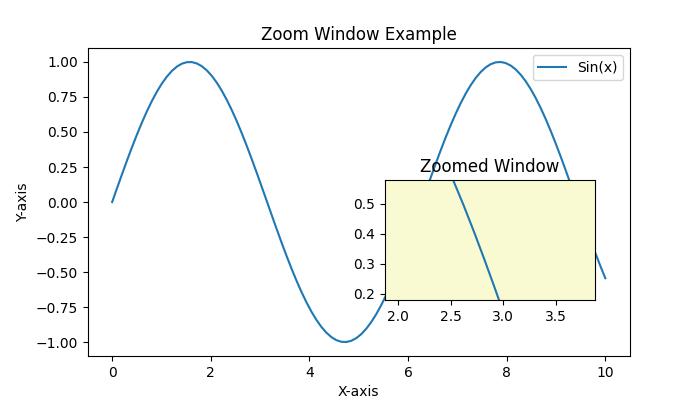
Example 2
Let's create another example of creating Zoom Window using Matplotlib. In this example, a simple sine wave plotted on the main axis, and a smaller zoomable window created using the plt.axes() method. When you click on a point in the main plot, the on_press function is triggered, adjusting the limits of the zoomed window to create a zoom effect centered at the clicked point.
import matplotlib.pyplot as plt
import numpy as np

# Generate data
x = np.linspace(0, 10, 100)
y = np.sin(x)

# Create a figure and axis
fig, ax = plt.subplots(figsize=(7, 4))
ax.plot(x, y, label='Sin(x)')
ax.set_title('Zoom Window Example')
ax.set_xlabel('X-axis')
ax.set_ylabel('Y-axis')
ax.legend()

# Create a zoomable window
zoomed_ax = plt.axes([0.55, 0.25, 0.3, 0.3], facecolor='lightgoldenrodyellow')
zoomed_ax.plot(x, y, label='Sin(x)')
zoomed_ax.set_title('Zoomed Window')
zoomed_ax.set_xlim(2, 4)
zoomed_ax.set_ylim(0.5, 1)

def on_press(event):
   if event.button != 1:
      return
   x, y = event.xdata, event.ydata
   zoomed_ax.set_xlim(x - 1, x + 1)
   zoomed_ax.set_ylim(y - 0.2, y + 0.2)
   fig.canvas.draw()

# Connect the event handler to the figure
fig.canvas.mpl_connect('button_press_event', on_press)

plt.show()
Output
On executing the above program, you will get the following output −
Watch the video below to observe how the zoom window feature works here.
To Continue Learning Please Login