- Matplotlib Basics
- Matplotlib - Home
- Matplotlib - Introduction
- Matplotlib - Vs Seaborn
- Matplotlib - Environment Setup
- Matplotlib - Anaconda distribution
- Matplotlib - Jupyter Notebook
- Matplotlib - Pyplot API
- Matplotlib - Simple Plot
- Matplotlib - Saving Figures
- Matplotlib - Markers
- Matplotlib - Figures
- Matplotlib - Styles
- Matplotlib - Legends
- Matplotlib - Colors
- Matplotlib - Colormaps
- Matplotlib - Colormap Normalization
- Matplotlib - Choosing Colormaps
- Matplotlib - Colorbars
- Matplotlib - Text
- Matplotlib - Text properties
- Matplotlib - Subplot Titles
- Matplotlib - Images
- Matplotlib - Image Masking
- Matplotlib - Annotations
- Matplotlib - Arrows
- Matplotlib - Fonts
- Matplotlib - What are Fonts?
- Setting Font Properties Globally
- Matplotlib - Font Indexing
- Matplotlib - Font Properties
- Matplotlib - Scales
- Matplotlib - Linear and Logarthmic Scales
- Matplotlib - Symmetrical Logarithmic and Logit Scales
- Matplotlib - LaTeX
- Matplotlib - What is LaTeX?
- Matplotlib - LaTeX for Mathematical Expressions
- Matplotlib - LaTeX Text Formatting in Annotations
- Matplotlib - PostScript
- Enabling LaTex Rendering in Annotations
- Matplotlib - Mathematical Expressions
- Matplotlib - Animations
- Matplotlib - Artists
- Matplotlib - Styling with Cycler
- Matplotlib - Paths
- Matplotlib - Path Effects
- Matplotlib - Transforms
- Matplotlib - Ticks and Tick Labels
- Matplotlib - Radian Ticks
- Matplotlib - Dateticks
- Matplotlib - Tick Formatters
- Matplotlib - Tick Locators
- Matplotlib - Basic Units
- Matplotlib - Autoscaling
- Matplotlib - Reverse Axes
- Matplotlib - Logarithmic Axes
- Matplotlib - Symlog
- Matplotlib - Unit Handling
- Matplotlib - Ellipse with Units
- Matplotlib - Spines
- Matplotlib - Axis Ranges
- Matplotlib - Axis Scales
- Matplotlib - Axis Ticks
- Matplotlib - Formatting Axes
- Matplotlib - Axes Class
- Matplotlib - Twin Axes
- Matplotlib - Figure Class
- Matplotlib - Multiplots
- Matplotlib - Grids
- Matplotlib - Object-oriented Interface
- Matplotlib - PyLab module
- Matplotlib - Subplots() Function
- Matplotlib - Subplot2grid() Function
- Matplotlib - Anchored Artists
- Matplotlib - Manual Contour
- Matplotlib - Coords Report
- Matplotlib - AGG filter
- Matplotlib - Ribbon Box
- Matplotlib - Fill Spiral
- Matplotlib - Findobj Demo
- Matplotlib - Hyperlinks
- Matplotlib - Image Thumbnail
- Matplotlib - Plotting with Keywords
- Matplotlib - Create Logo
- Matplotlib - Multipage PDF
- Matplotlib - Multiprocessing
- Matplotlib - Print Stdout
- Matplotlib - Compound Path
- Matplotlib - Sankey Class
- Matplotlib - MRI with EEG
- Matplotlib - Stylesheets
- Matplotlib - Background Colors
- Matplotlib - Basemap
- Matplotlib Event Handling
- Matplotlib - Event Handling
- Matplotlib - Close Event
- Matplotlib - Mouse Move
- Matplotlib - Click Events
- Matplotlib - Scroll Event
- Matplotlib - Keypress Event
- Matplotlib - Pick Event
- Matplotlib - Looking Glass
- Matplotlib - Path Editor
- Matplotlib - Poly Editor
- Matplotlib - Timers
- Matplotlib - Viewlims
- Matplotlib - Zoom Window
- Matplotlib Plotting
- Matplotlib - Bar Graphs
- Matplotlib - Histogram
- Matplotlib - Pie Chart
- Matplotlib - Scatter Plot
- Matplotlib - Box Plot
- Matplotlib - Violin Plot
- Matplotlib - Contour Plot
- Matplotlib - 3D Plotting
- Matplotlib - 3D Contours
- Matplotlib - 3D Wireframe Plot
- Matplotlib - 3D Surface Plot
- Matplotlib - Quiver Plot
- Matplotlib Useful Resources
- Matplotlib - Quick Guide
- Matplotlib - Useful Resources
- Matplotlib - Discussion
Matplotlib - Markers
In Matplotlib markers are used to highlight individual data points on a plot. The marker parameter in the plot() function is used to specify the marker style. The following is the syntax for using markers in Matplotlib.
Syntax
The following is the syntax and parameters of using the markers in matplotlib library.
plt.plot(x, y, marker='marker_style')
Where,
x and y − Arrays or sequences of values representing the data points to be plotted.
marker − Specifies the marker style to be used. It can be a string or one of the following marker styles:
| Sr.No. | Marker & Definition |
|---|---|
| 1 | . Point marker |
| 2 | , Pixel marker |
| 3 | o Circle marker |
| 4 | v Triangle down marker |
| 5 | ^ Triangle up marker |
| 6 | < Triangle left marker |
| 7 | > Triangle right marker |
| 8 | 1 Downward-pointing triangle marker |
| 9 | 2 Upward-pointing triangle marker |
| 10 | 3 Left-pointing triangle marker |
| 11 | 4 Right-pointing triangle marker |
| 12 | s Square marker |
| 13 | p Pentagon marker |
| 14 | * Star marker |
| 15 | h Hexagon marker (1) |
| 16 | H Hexagon marker (2) |
| 17 | + Plus marker |
| 18 | x Cross marker |
| 19 | D Diamond marker |
| 20 | d Thin diamond marker |
| 21 | − Horizontal line marker |
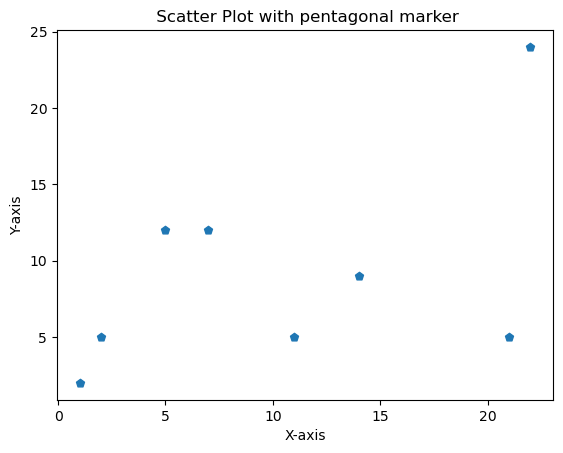
Scatterplot with pentagonal marker
Here in this example we are creating the scatterplot with the pentagonal marker by using the scatter() function of the pyplot module.
Example
import matplotlib.pyplot as plt
# Data
x = [22,1,7,2,21,11,14,5]
y = [24,2,12,5,5,5,9,12]
plt.scatter(x,y, marker = 'p')

# Customize the plot (optional)
plt.xlabel('X-axis')
plt.ylabel('Y-axis')
plt.title(' Scatter Plot with pentagonal marker')

# Display the plot
plt.show()
Output
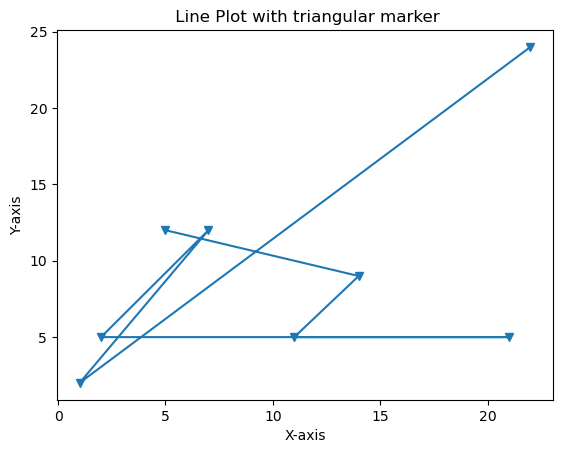
Line plot with triangular marker
In this example we are creating a line plot with the triangle marker by providing marker values as 'v' to the plot() function of the pyplot module.
Example
import matplotlib.pyplot as plt
# Data
x = [22,1,7,2,21,11,14,5]
y = [24,2,12,5,5,5,9,12]
plt.plot(x,y, marker = 'v')

# Customize the plot (optional)
plt.xlabel('X-axis')
plt.ylabel('Y-axis')
plt.title(' Line Plot with triangular marker')

# Display the plot
plt.show()
Output
To Continue Learning Please Login