- Matplotlib Basics
- Matplotlib - Home
- Matplotlib - Introduction
- Matplotlib - Vs Seaborn
- Matplotlib - Environment Setup
- Matplotlib - Anaconda distribution
- Matplotlib - Jupyter Notebook
- Matplotlib - Pyplot API
- Matplotlib - Simple Plot
- Matplotlib - Saving Figures
- Matplotlib - Markers
- Matplotlib - Figures
- Matplotlib - Styles
- Matplotlib - Legends
- Matplotlib - Colors
- Matplotlib - Colormaps
- Matplotlib - Colormap Normalization
- Matplotlib - Choosing Colormaps
- Matplotlib - Colorbars
- Matplotlib - Text
- Matplotlib - Text properties
- Matplotlib - Subplot Titles
- Matplotlib - Images
- Matplotlib - Image Masking
- Matplotlib - Annotations
- Matplotlib - Arrows
- Matplotlib - Fonts
- Matplotlib - What are Fonts?
- Setting Font Properties Globally
- Matplotlib - Font Indexing
- Matplotlib - Font Properties
- Matplotlib - Scales
- Matplotlib - Linear and Logarthmic Scales
- Matplotlib - Symmetrical Logarithmic and Logit Scales
- Matplotlib - LaTeX
- Matplotlib - What is LaTeX?
- Matplotlib - LaTeX for Mathematical Expressions
- Matplotlib - LaTeX Text Formatting in Annotations
- Matplotlib - PostScript
- Enabling LaTex Rendering in Annotations
- Matplotlib - Mathematical Expressions
- Matplotlib - Animations
- Matplotlib - Artists
- Matplotlib - Styling with Cycler
- Matplotlib - Paths
- Matplotlib - Path Effects
- Matplotlib - Transforms
- Matplotlib - Ticks and Tick Labels
- Matplotlib - Radian Ticks
- Matplotlib - Dateticks
- Matplotlib - Tick Formatters
- Matplotlib - Tick Locators
- Matplotlib - Basic Units
- Matplotlib - Autoscaling
- Matplotlib - Reverse Axes
- Matplotlib - Logarithmic Axes
- Matplotlib - Symlog
- Matplotlib - Unit Handling
- Matplotlib - Ellipse with Units
- Matplotlib - Spines
- Matplotlib - Axis Ranges
- Matplotlib - Axis Scales
- Matplotlib - Axis Ticks
- Matplotlib - Formatting Axes
- Matplotlib - Axes Class
- Matplotlib - Twin Axes
- Matplotlib - Figure Class
- Matplotlib - Multiplots
- Matplotlib - Grids
- Matplotlib - Object-oriented Interface
- Matplotlib - PyLab module
- Matplotlib - Subplots() Function
- Matplotlib - Subplot2grid() Function
- Matplotlib - Anchored Artists
- Matplotlib - Manual Contour
- Matplotlib - Coords Report
- Matplotlib - AGG filter
- Matplotlib - Ribbon Box
- Matplotlib - Fill Spiral
- Matplotlib - Findobj Demo
- Matplotlib - Hyperlinks
- Matplotlib - Image Thumbnail
- Matplotlib - Plotting with Keywords
- Matplotlib - Create Logo
- Matplotlib - Multipage PDF
- Matplotlib - Multiprocessing
- Matplotlib - Print Stdout
- Matplotlib - Compound Path
- Matplotlib - Sankey Class
- Matplotlib - MRI with EEG
- Matplotlib - Stylesheets
- Matplotlib - Background Colors
- Matplotlib - Basemap
- Matplotlib Event Handling
- Matplotlib - Event Handling
- Matplotlib - Close Event
- Matplotlib - Mouse Move
- Matplotlib - Click Events
- Matplotlib - Scroll Event
- Matplotlib - Keypress Event
- Matplotlib - Pick Event
- Matplotlib - Looking Glass
- Matplotlib - Path Editor
- Matplotlib - Poly Editor
- Matplotlib - Timers
- Matplotlib - Viewlims
- Matplotlib - Zoom Window
- Matplotlib Plotting
- Matplotlib - Bar Graphs
- Matplotlib - Histogram
- Matplotlib - Pie Chart
- Matplotlib - Scatter Plot
- Matplotlib - Box Plot
- Matplotlib - Violin Plot
- Matplotlib - Contour Plot
- Matplotlib - 3D Plotting
- Matplotlib - 3D Contours
- Matplotlib - 3D Wireframe Plot
- Matplotlib - 3D Surface Plot
- Matplotlib - Quiver Plot
- Matplotlib Useful Resources
- Matplotlib - Quick Guide
- Matplotlib - Useful Resources
- Matplotlib - Discussion
Matplotlib - Viewlims
Viewlims or View limits, refer to the range of data that is displayed within a plot along the x and y axes. Viewlims are useful for interactive data visualization because they allow users to dynamically adjust the display of data.
Matplotlib provides various methods and tools for setting and updating viewlims interactively, enabling users to explore and analyze data effectively. In general, view limits are automatically determined based on the data being plotted in matplotlib plots.
This tutorial will see step by setp implementation of creating interactive zoom functionality in a Matplotlib plot with viewlims to create dynamic visualizations coresponding to the user interactions.
Creating an Interactive Zoom Plot
Create a class that regenerates a fractal set (the Mandelbrot set is a famous fractal in mathematics) as we zoom in, allowing us to observe increasing detail. Additionally, we'll display a box in the left panel to show the area to which we are zoomed.
This class defines the compute_image method to calculate the Mandelbrot set based on the provided bounds. And the axes_update method updates the plot based on the current view limits. It ensures that the Mandelbrot set is recalculated and redrawn whenever the view limits change.
class InteractiveFractal:

   def __init__(self, h=500, w=500, niter=50, radius=2., power=2):
      self.height = h
      self.width = w
      self.niter = niter
      self.radius = radius
      self.power = power

   def compute_image(self, xstart, xend, ystart, yend):
      self.x = np.linspace(xstart, xend, self.width)
      self.y = np.linspace(ystart, yend, self.height).reshape(-1, 1)
      c = self.x + 1.0j * self.y
      threshold_time = np.zeros((self.height, self.width))
      z = np.zeros(threshold_time.shape, dtype=complex)
      mask = np.ones(threshold_time.shape, dtype=bool)
      for i in range(self.niter):
         z[mask] = z[mask]**self.power + c[mask]
         mask = (np.abs(z) < self.radius)
         threshold_time += mask
      return threshold_time

   def axes_update(self, ax):
      ax.set_autoscale_on(False)

      self.width, self.height = \
         np.round(ax.patch.get_window_extent().size).astype(int)

      vl = ax.viewLim
      extent = vl.x0, vl.x1, vl.y0, vl.y1

      im = ax.images[-1]
      im.set_data(self.compute_image(*extent))
      im.set_extent(extent)
      ax.figure.canvas.draw_idle()
Updating View Limits
We'll create a class UpdateRectangle to create a rectangle that represents the area to which we are zoomed in the Mandelbrot set. This class extends the Rectangle class and is used to update the rectangle representing the zoom area as the view limits change. As we zoom in on the left panel, the rectangle will update its shape to match the bounds of the axes.
class UpdateRectangle(Rectangle):
   def __call__(self, ax):
      self.set_bounds(*ax.viewLim.bounds)
      ax.figure.canvas.draw_idle()
Connecting Callbacks
Callbacks are connected to the xlim_changed and ylim_changed events of the second subplot (ax2). These callbacks trigger the update of the rectangle and the Mandelbrot set whenever the view limits change.
# Connect for changing the view limits
ax2.callbacks.connect('xlim_changed', rect)
ax2.callbacks.connect('ylim_changed', rect)

ax2.callbacks.connect('xlim_changed', md.ax_update)
ax2.callbacks.connect('ylim_changed', md.ax_update)
Here is the complete code
The Mandelbrot set is initially plotted in two subplots (ax1 and ax2). The rectangle representing the zoom area is added to ax1, and callbacks are connected to ax2 to handle view limit changes.
Example
import matplotlib.pyplot as plt
import numpy as np
from matplotlib.patches import Rectangle
class UpdateRectangle(Rectangle):
def __call__(self, ax):
self.set_bounds(*ax.viewLim.bounds)
ax.figure.canvas.draw_idle()
class InteractiveFractal:
def __init__(self, h=500, w=500, niter=50, radius=2., power=2):
self.height = h
self.width = w
self.niter = niter
self.radius = radius
self.power = power
def compute_image(self, xstart, xend, ystart, yend):
self.x = np.linspace(xstart, xend, self.width)
self.y = np.linspace(ystart, yend, self.height).reshape(-1, 1)
c = self.x + 1.0j * self.y
threshold_time = np.zeros((self.height, self.width))
z = np.zeros(threshold_time.shape, dtype=complex)
mask = np.ones(threshold_time.shape, dtype=bool)
for i in range(self.niter):
z[mask] = z[mask]**self.power + c[mask]
mask = (np.abs(z) < self.radius)
threshold_time += mask
return threshold_time
def axes_update(self, ax):
ax.set_autoscale_on(False)
self.width, self.height = \
np.round(ax.patch.get_window_extent().size).astype(int)
vl = ax.viewLim
extent = vl.x0, vl.x1, vl.y0, vl.y1
im = ax.images[-1]
im.set_data(self.compute_image(*extent))
im.set_extent(extent)
ax.figure.canvas.draw_idle()
md = InteractiveFractal()
Z = md.compute_image(-2., 0.5, -1.25, 1.25)
fig1, (ax1, ax2) = plt.subplots(1, 2, figsize=(7, 4))
ax1.imshow(Z, origin='lower',
extent=(md.x.min(), md.x.max(), md.y.min(), md.y.max()))
ax2.imshow(Z, origin='lower',
extent=(md.x.min(), md.x.max(), md.y.min(), md.y.max()))
rect = UpdateRectangle(
[0, 0], 0, 0, facecolor='none', edgecolor='black', linewidth=1.0)
rect.set_bounds(*ax2.viewLim.bounds)
ax1.add_patch(rect)
# Connect for changing the view limits
ax2.callbacks.connect('xlim_changed', rect)
ax2.callbacks.connect('ylim_changed', rect)
ax2.callbacks.connect('xlim_changed', md.axes_update)
ax2.callbacks.connect('ylim_changed', md.axes_update)
ax2.set_title("Zoom here")
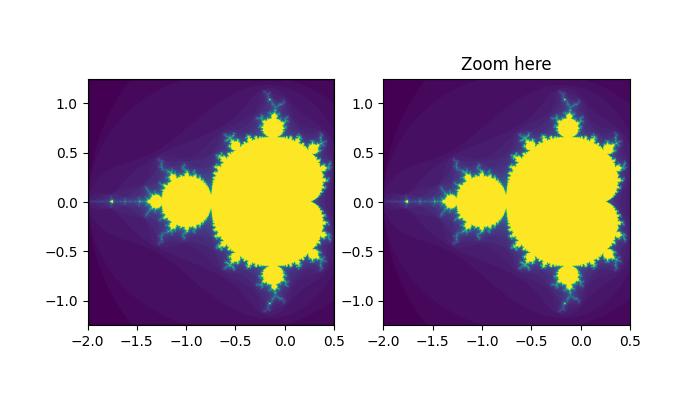
plt.show()
Output
On executing the above program you will get the following output −
 Observe the below video to see how the viewlims works here −
To Continue Learning Please Login