- Aptitude Test Preparation
- Aptitude - Home
- Aptitude - Overview
- Quantitative Aptitude
- Aptitude Useful Resources
- Aptitude - Questions & Answers
Line Charts - Online Quiz
Following quiz provides Multiple Choice Questions (MCQs) related to Line Charts. You will have to read all the given answers and click over the correct answer. If you are not sure about the answer then you can check the answer using Show Answer button. You can use Next Quiz button to check new set of questions in the quiz.

Directions: The chart given underneath demonstrates the assembling volume (in kg), expense value (Rs. /kg) and offering value (Rs. /kg) of an article over year. Study the chart and answer the question given below:
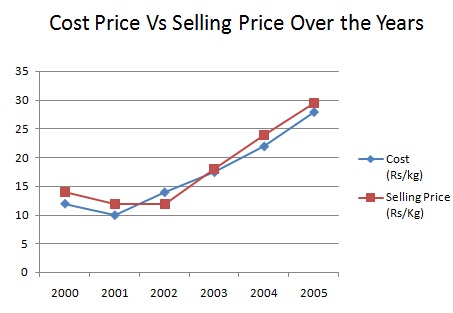
Q 1 - In which of the next years was the most extreme benefit produced?
Answer - C
Explanation
benefit created :
2000 = Rs [(14-12)*120] = Rs.240
2001 = Rs [(12-10)*150] = Rs. 300
2004 = Rs [(24-22)*160] = Rs. 320
2005 = Rs [(29.5-28)*170] = Rs. 255
Directions: The chart given underneath demonstrates the assembling volume (in kg), expense value (Rs. /kg) and offering value (Rs. /kg) of an article over year. Study the chart and answer the question given below:
Q 2 - In the event that the percent development for the expense proceeds from 2005 to 2006 as from 2004 to 2005, what be the aggregate expense per kg in 2006?
Answer - B
Explanation
Percent development in expense from 2004 to 2005 .
= {(28-22)/22*100} % = (6/22*100) % = 300/11%
Taken a toll for every Kg in 2006
= Rs. [28+ (300/11 *1/100* 28)] = Rs. 392/11 = Rs. 35.63
Directions: Study the graph below carefully and answer the following:
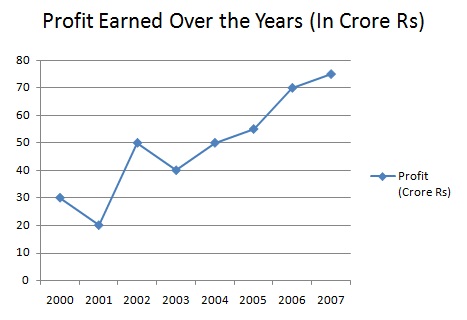
Q 3 - On the off chance that the consumption in the year 2005 was Rs. 60 crores, what amount was the pay in crore rupees?
Answer - B
Explanation
Gain in 2005 = income- expenditure
⇒ Income = (gain+ expenditure) = (60+55) = 115 crore.
Directions: Study the graph below carefully and answer the following:
Q 4 - What is the inexact % expansion in the benefit of the year 2004. On the off chance that the pay of that year was Rs. 120 crore?
Answer - C
Explanation
Increase% in gain in 2007
= {(75-70)/70*100} %
= (5/70*100) %
= 7%
Directions: Study the graph below carefully and answer the following:
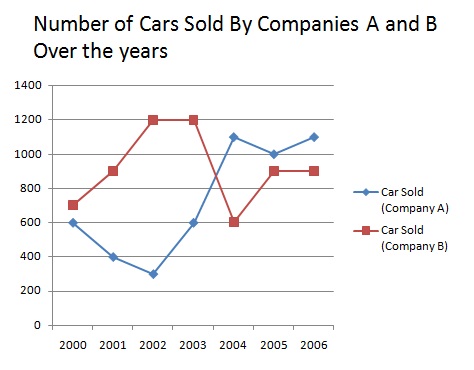
Q 5 - Deals in the year 2004 for organization A structures what % of aggregate offers of organization A for every one of the years together?
Answer - A
Explanation
Total sale of Company A in 2004  =1100
Total sale of A during These years = (600+900+300+600+1100+1000+1100)= 5600
Required % = (1100/5600*100) % = 19.64%
Directions: Study the graph below carefully and answer the following:
Q 6 - Absolute offers of Company B for the years 2000, 2001 and 2004 together are what % of the offers of organization B for every one of the years together?
Answer - C
Explanation
Total sale of B for the year 2000, 2001 and 2004 = (700+400+600) = 1700
Total sales of B over the years = (700+400+1200+1200+600+900+900) =  5900
∴ Required % = (1700/5900*100) % = 28.81%
Directions: Study the graph below carefully and answer the following:
Q 7 - Amid which year the percent rise/fall in deals from the earlier year was the most elevated for Organization A?
Answer - D
Explanation
In the year 2003,A has 100% rise.
In the year 2002, we have fall% = {(900-300/600)*100} = 66.67%
So, the highest change is in 2003.
Directions: Study the graph below carefully and answer the following:
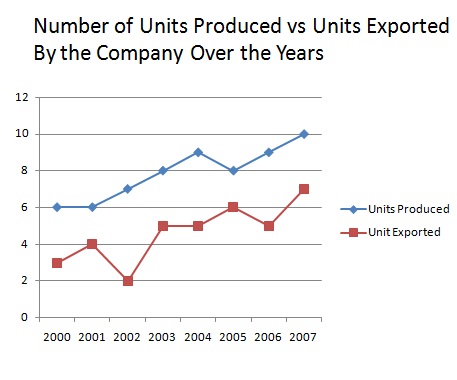
Q 8 - What is the normal number of units sent out throughout the years?
Answer - C
Explanation
Average number of units exported over the year
= 1/8 (3+4+2+5+5+6+5+7) = 37/8 crores
= 37/8*10000000 = 37* 1250000 = 46250000.
Directions: Study the graph below carefully and answer the following:
Q 9 - What is the contrast between the quantity of units sent out in 2001 and 2002?
Answer - A
Explanation
Required difference = (4-2)crore = 2 crore = 20000000.
Directions: Study the graph below carefully and answer the following:
Q 10 - In which year, the percent ascend in units delivered from the former year, is the most extreme?
Answer - D
Explanation
Required %  in
2002 = {(7-6)/6* 100} % = 16.67%,
2003 = {(8-7)/7*100} % =14.28%,
2004 = {(9-8)/8* 100} % =12.5%,
2006 ={(9-8)/8* 100}% =12.5%
2007 = {(10-9)/9* 100} % =11.1%
∴ It is maximum in the year 2002.
To Continue Learning Please Login