- Matplotlib Basics
- Matplotlib - Home
- Matplotlib - Introduction
- Matplotlib - Vs Seaborn
- Matplotlib - Environment Setup
- Matplotlib - Anaconda distribution
- Matplotlib - Jupyter Notebook
- Matplotlib - Pyplot API
- Matplotlib - Simple Plot
- Matplotlib - Saving Figures
- Matplotlib - Markers
- Matplotlib - Figures
- Matplotlib - Styles
- Matplotlib - Legends
- Matplotlib - Colors
- Matplotlib - Colormaps
- Matplotlib - Colormap Normalization
- Matplotlib - Choosing Colormaps
- Matplotlib - Colorbars
- Matplotlib - Text
- Matplotlib - Text properties
- Matplotlib - Subplot Titles
- Matplotlib - Images
- Matplotlib - Image Masking
- Matplotlib - Annotations
- Matplotlib - Arrows
- Matplotlib - Fonts
- Matplotlib - What are Fonts?
- Setting Font Properties Globally
- Matplotlib - Font Indexing
- Matplotlib - Mathematical Expressions
- Matplotlib - Transforms
- Matplotlib - Ticks and Tick Labels
- Matplotlib - Axis Ranges
- Matplotlib - Axis Scales
- Matplotlib - Axis Ticks
- Matplotlib - Formatting Axes
- Matplotlib - Axes Class
- Matplotlib - Twin Axes
- Matplotlib - Figure Class
- Matplotlib - Multiplots
- Matplotlib - Grids
- Matplotlib - Object-oriented Interface
- Matplotlib - PyLab module
- Matplotlib - Subplots() Function
- Matplotlib - Subplot2grid() Function
- Matplotlib - Anchored Artists
- Matplotlib - Manual Contour
- Matplotlib - Coords Report
- Matplotlib - AGG filter
- Matplotlib - Ribbon Box
- Matplotlib - Fill Spiral
- Matplotlib - Findobj Demo
- Matplotlib - Hyperlinks
- Matplotlib - Image Thumbnail
- Matplotlib - Plotting with Keywords
- Matplotlib - Create Logo
- Matplotlib - Multipage PDF
- Matplotlib - Multiprocessing
- Matplotlib - Print Stdout
- Matplotlib - Compound Path
- Matplotlib - Sankey Class
- Matplotlib - MRI with EEG
- Matplotlib - Stylesheets
- Matplotlib - Background Colors
- Matplotlib - Basemap
- Matplotlib Event Handling
- Matplotlib - Event Handling
- Matplotlib - Close Event
- Matplotlib - Mouse Move
- Matplotlib - Click Events
- Matplotlib - Scroll Event
- Matplotlib - Keypress Event
- Matplotlib - Pick Event
- Matplotlib - Looking Glass
- Matplotlib - Path Editor
- Matplotlib - Poly Editor
- Matplotlib - Timers
- Matplotlib - Viewlims
- Matplotlib - Zoom Window
- Matplotlib Plotting
- Matplotlib - Bar Graphs
- Matplotlib - Histogram
- Matplotlib - Pie Chart
- Matplotlib - Scatter Plot
- Matplotlib - Box Plot
- Matplotlib - Violin Plot
- Matplotlib - Contour Plot
- Matplotlib - 3D Plotting
- Matplotlib - 3D Contours
- Matplotlib - 3D Wireframe Plot
- Matplotlib - 3D Surface Plot
- Matplotlib - Quiver Plot
- Matplotlib Useful Resources
- Matplotlib - Quick Guide
- Matplotlib - Useful Resources
- Matplotlib - Discussion
Matplotlib - Check Buttons
What is Check Buttons?
Matplotlib's Check Buttons provide a powerful mechanism for adding interactive checkbox functionality to our plots. This feature allows users to toggle the visibility of specific elements, datasets or annotations within the plot dynamically. Check Buttons are particularly useful when dealing with complex visualizations where displaying or hiding certain components enhances the clarity of the data presentation.
Overview of the check buttons
Check Buttons consist of a set of checkboxes associated with specific actions or functionalities in our plot. Users can interact with these checkboxes to control the visibility or behavior of corresponding elements. Common use cases include toggling the display of different datasets, showing or hiding annotations or activating/deactivating specific features within the plot.
There is step by step process for applying the check buttons to the plot.
Creating Check Buttons
Importing Necessary Libraries
Here to apply the check buttons to the matplotlib plots first we have to import the necessary required libraries by using the below code.
import matplotlib.pyplot as plt
from matplotlib.widgets import CheckButtons
Creating a Figure and Axes
Creating a figure and axes in Matplotlib for use with Check Buttons involves setting up the canvas (figure) and the plotting area (axes). Here's an example of how to create a figure and axes and use them with Check Buttons.
Example
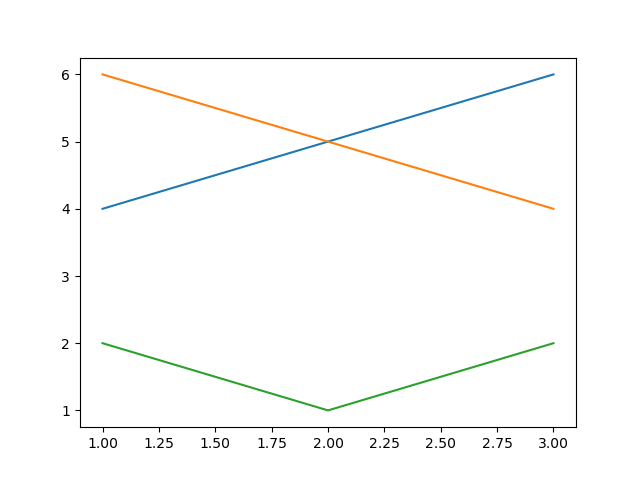
import matplotlib.pyplot as plt
# Creating a figure and axes
fig, ax = plt.subplots()
# Plotting elements with initial visibility based on the list
line1, = ax.plot([1, 2, 3], [4, 5, 6], label='Line 1')
line2, = ax.plot([1, 2, 3], [6, 5, 4], label='Line 2')
line3, = ax.plot([1, 2, 3], [2, 1, 2], label='Line 3')
plt.show()
Output
Defining Initial Visibility Status
Defining the initial visibility status is a crucial step when working with Check Buttons in Matplotlib. The initial visibility status determines whether the associated elements such as lines in a plot are initially visible or hidden. Here's how we can define the initial visibility status for Check Buttons.
Example
In this example the list visibility_status contains three Boolean values such as True or False each corresponding to the initial visibility status of a specific element.
import matplotlib.pyplot as plt
from matplotlib.widgets import CheckButtons
def update_visibility(label):
if label == 'Line 1':
line1.set_visible(not line1.get_visible())
elif label == 'Line 2':
line2.set_visible(not line2.get_visible())
elif label == 'Line 3':
line3.set_visible(not line3.get_visible())
plt.draw()
# Creating a figure and axes
fig, ax = plt.subplots()
# Defining initial visibility status
visibility_status = [True, True, True]
# Plotting elements with initial visibility based on the list
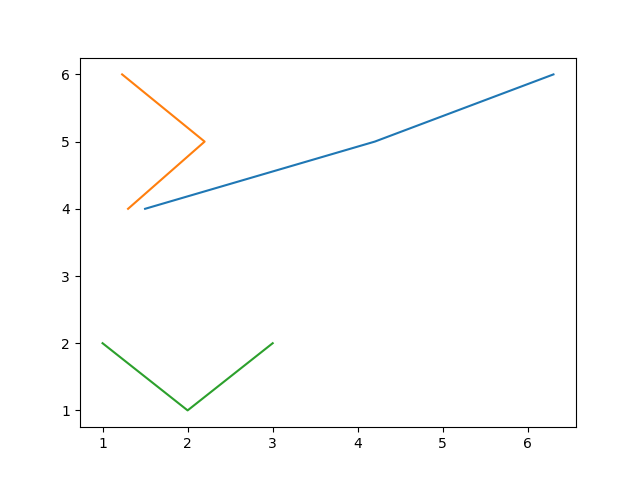
line1, = ax.plot([1.5, 4.2, 6.3], [4, 5, 6], label='Line 1', visible=visibility_status[0])
line2, = ax.plot([1.23, 2.2, 1.3], [6, 5, 4], label='Line 2', visible=visibility_status[1])
line3, = ax.plot([1, 2, 3], [2, 1, 2], label='Line 3', visible=visibility_status[2])
plt.show()
Output
Plotting Elements and Updating Plot Based on Checkbox State
Create the elements that we want to control with Check Buttons and add them to the plot.
Creating Check Buttons
Define the location and dimensions of the Check Buttons within the plot and create the CheckButtons object. The CheckButtons object is associated with the checkboxes for each line and the visibility_status list determines their initial state.
Connecting Check Button Click Event
Connect the click event of the Check Buttons to the update function.
Example
import matplotlib.pyplot as plt
from matplotlib.widgets import CheckButtons
# Creating a figure and axes
fig, ax = plt.subplots()
# Defining initial visibility status
visibility_status = [True, True, True]
# Plotting elements with initial visibility based on the list
line1, = ax.plot([1, 2, 3], [4, 5, 6], label='Line 1', visible=visibility_status[0])
line2, = ax.plot([1, 2, 3], [6, 5, 4], label='Line 2', visible=visibility_status[1])
line3, = ax.plot([1, 2, 3], [2, 1, 2], label='Line 3', visible=visibility_status[2])
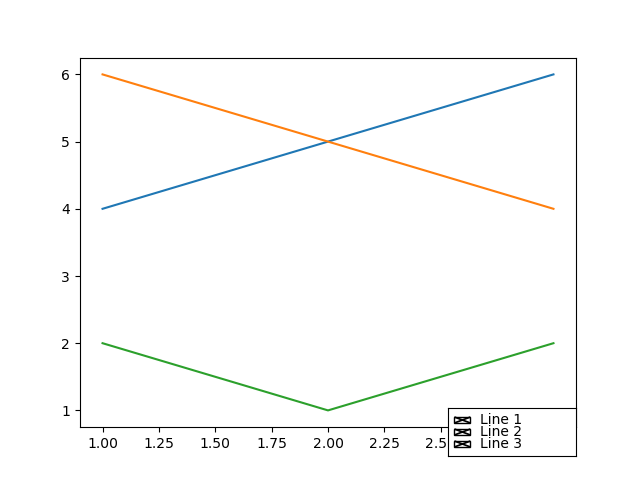
# Creating Check Buttons
check_ax = plt.axes([0.7, 0.05, 0.2, 0.1])
check_buttons = CheckButtons(check_ax, ['Line 1', 'Line 2', 'Line 3'], visibility_status)
# Function to update visibility based on checkbox state
def update_visibility(label):
if label == 'Line 1':
line1.set_visible(not line1.get_visible())
elif label == 'Line 2':
line2.set_visible(not line2.get_visible())
elif label == 'Line 3':
line3.set_visible(not line3.get_visible())
plt.draw()
# Connecting Check Button Click Event
check_buttons.on_clicked(update_visibility)
plt.show()
Output
Customization and Interaction
We can apply the customizations and Interactions as per our requirement and need.
Checkbox Labels − Customize the labels of the checkboxes to match the elements they control.
Colors and Styling − Adjust the appearance of checkboxes, including colors, sizes and styles.
Dynamic Updates − The update_visibility function can be extended to include additional actions or modifications based on checkbox states.
Integration with Widgets − Combine Check Buttons with other widgets like buttons or sliders for comprehensive interactive features.
To Continue Learning Please Login