- Matplotlib Basics
- Matplotlib - Home
- Matplotlib - Introduction
- Matplotlib - Vs Seaborn
- Matplotlib - Environment Setup
- Matplotlib - Anaconda distribution
- Matplotlib - Jupyter Notebook
- Matplotlib - Pyplot API
- Matplotlib - Simple Plot
- Matplotlib - Saving Figures
- Matplotlib - Markers
- Matplotlib - Figures
- Matplotlib - Styles
- Matplotlib - Legends
- Matplotlib - Colors
- Matplotlib - Colormaps
- Matplotlib - Colormap Normalization
- Matplotlib - Choosing Colormaps
- Matplotlib - Colorbars
- Matplotlib - Text
- Matplotlib - Text properties
- Matplotlib - Subplot Titles
- Matplotlib - Images
- Matplotlib - Image Masking
- Matplotlib - Annotations
- Matplotlib - Arrows
- Matplotlib - Fonts
- Matplotlib - What are Fonts?
- Setting Font Properties Globally
- Matplotlib - Font Indexing
- Matplotlib - Mathematical Expressions
- Matplotlib - Transforms
- Matplotlib - Ticks and Tick Labels
- Matplotlib - Axis Ranges
- Matplotlib - Axis Scales
- Matplotlib - Axis Ticks
- Matplotlib - Formatting Axes
- Matplotlib - Axes Class
- Matplotlib - Twin Axes
- Matplotlib - Figure Class
- Matplotlib - Multiplots
- Matplotlib - Grids
- Matplotlib - Object-oriented Interface
- Matplotlib - PyLab module
- Matplotlib - Subplots() Function
- Matplotlib - Subplot2grid() Function
- Matplotlib - Anchored Artists
- Matplotlib - Manual Contour
- Matplotlib - Coords Report
- Matplotlib - AGG filter
- Matplotlib - Ribbon Box
- Matplotlib - Fill Spiral
- Matplotlib - Findobj Demo
- Matplotlib - Hyperlinks
- Matplotlib - Image Thumbnail
- Matplotlib - Plotting with Keywords
- Matplotlib - Create Logo
- Matplotlib - Multipage PDF
- Matplotlib - Multiprocessing
- Matplotlib - Print Stdout
- Matplotlib - Compound Path
- Matplotlib - Sankey Class
- Matplotlib - MRI with EEG
- Matplotlib - Stylesheets
- Matplotlib - Background Colors
- Matplotlib - Basemap
- Matplotlib Event Handling
- Matplotlib - Event Handling
- Matplotlib - Close Event
- Matplotlib - Mouse Move
- Matplotlib - Click Events
- Matplotlib - Scroll Event
- Matplotlib - Keypress Event
- Matplotlib - Pick Event
- Matplotlib - Looking Glass
- Matplotlib - Path Editor
- Matplotlib - Poly Editor
- Matplotlib - Timers
- Matplotlib - Viewlims
- Matplotlib - Zoom Window
- Matplotlib Plotting
- Matplotlib - Bar Graphs
- Matplotlib - Histogram
- Matplotlib - Pie Chart
- Matplotlib - Scatter Plot
- Matplotlib - Box Plot
- Matplotlib - Violin Plot
- Matplotlib - Contour Plot
- Matplotlib - 3D Plotting
- Matplotlib - 3D Contours
- Matplotlib - 3D Wireframe Plot
- Matplotlib - 3D Surface Plot
- Matplotlib - Quiver Plot
- Matplotlib Useful Resources
- Matplotlib - Quick Guide
- Matplotlib - Useful Resources
- Matplotlib - Discussion
Matplotlib - MRI with EEG
MRI with EEG refers to a medical imaging technique that combines two different methods to study the brain: Magnetic Resonance Imaging (MRI) and Electroencephalography (EEG).
MRI (Magnetic Resonance Imaging) − MRI uses strong magnetic fields and radio waves to create detailed images of the inside of the body, including the brain. It helps doctors see the structure and anatomy of the brain, detecting abnormalities like tumors, injuries, or other conditions.
EEG (Electroencephalography) − EEG measures the electrical activity in the brain by placing electrodes on the scalp. It records the patterns of electrical impulses produced by brain cells, called neurons.
When MRI and EEG are combined, it allows doctors and researchers to study both the structure and activity of the brain simultaneously.
MRI with EEG in Matplotlib
Matplotlib allows you to create visualizations that integrate MRI images with EEG data, enabling the exploration and analysis of brain function and connectivity.
In Matplotlib, there isn't a specific function for creating MRI with EEG visualizations. Instead, you need to use a combination of Matplotlib's plotting functions to overlay EEG data onto MRI images. This involves loading and processing the MRI and EEG data separately, then using Matplotlib to display them together in a single plot.
You can use functions like imshow() to display the MRI image and plot() or scatter() to overlay the EEG data onto the MRI image. Additionally, you can adjust the appearance and layout of the plot using various customization options provided by Matplotlib.
Displaying MRI Slice
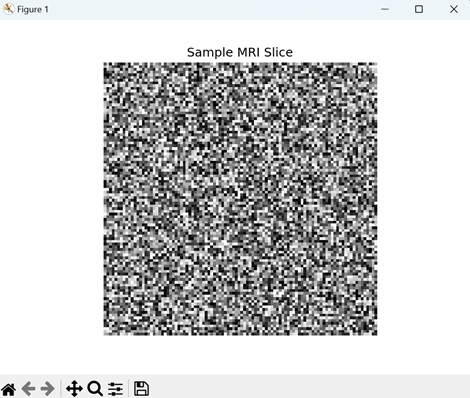
In Matplotlib, displaying an MRI slice involves visualizing a single two-dimensional cross-section of a three-dimensional MRI volume. This allows you to examine the internal structures of the body captured by the MRI scanner. You can load and display the MRI slice as an image within a plot using Matplotlib's plotting functions, such as imshow().
Example
In the following example, we are generating synthetic MRI data using np.random.rand, creating a 3D array of random numbers representing MRI voxel intensities. We save this synthetic MRI data to a NIfTI file named 'sample_mri.nii.gz' using Nibabel's nib.save. We then load the synthetic MRI data from the saved file using nib.load and display a single slice (slice index 50) of the MRI data using Matplotlib's imshow() function−
import matplotlib.pyplot as plt
import nibabel as nib
import numpy as np

# Generating sample MRI data
sample_data = np.random.rand(100, 100, 100)

# Saving sample MRI data to a NIfTI file
nib.save(nib.Nifti1Image(sample_data, np.eye(4)), 'sample_mri.nii.gz')

# Loading sample MRI data
mri_img = nib.load('sample_mri.nii.gz')
mri_data = mri_img.get_fdata()

# Displaying a single MRI slice
plt.imshow(mri_data[:, :, 50], cmap='gray')
plt.title('Sample MRI Slice')
plt.axis('off')
plt.show()
Output
Following is the output of the above code −
Plot EEG Signal
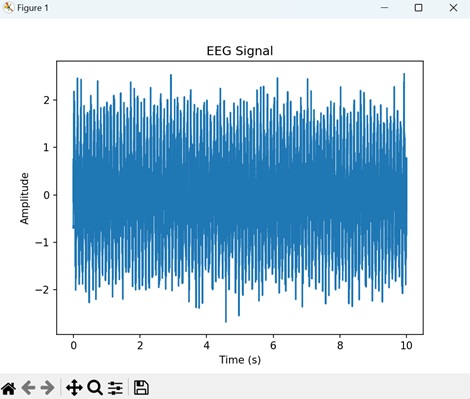
Plotting an EEG signal in Matplotlib involves visualizing the electrical activity recorded from electrodes placed on the scalp. EEG signals represent the brain's neural activity over time, capturing changes in electrical potentials associated with various brain states and activities.
In Matplotlib, you can plot EEG data using functions like plot() to display the signal amplitude over time. EEG plots typically have time on the x-axis and voltage or signal amplitude on the y-axis, allowing researchers and clinicians to analyze brain activity patterns, detect abnormalities, and study cognitive processes.
Example
In here, we are generating synthetic EEG data and plotting the EEG signal over time using Matplotlib's plot() function −
import matplotlib.pyplot as plt
import numpy as np

# Generating sample EEG data
# Sampling frequency (Hz)
fs = 1000
# Time vector (10 seconds)
t = np.arange(0, 10, 1/fs)
# Sample EEG signal
eeg_signal = np.sin(2 * np.pi * 10 * t) + 0.5 * np.random.randn(len(t))

# Plotting EEG signal
plt.plot(t, eeg_signal)
plt.title('EEG Signal')
plt.xlabel('Time (s)')
plt.ylabel('Amplitude')
plt.show()
Output
On executing the above code we will get the following output −
MRI Overlay with EEG Electrodes
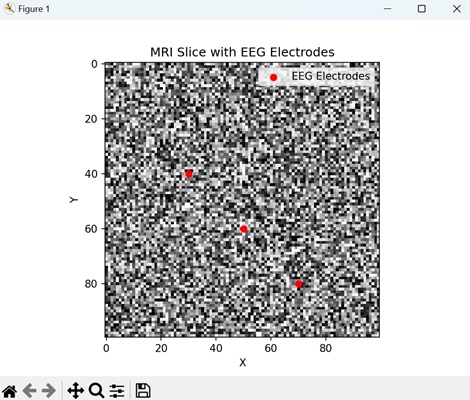
Overlaying EEG electrodes onto an MRI image in Matplotlib involves combining two different types of medical data for visualization. The MRI provides detailed anatomical information about the brain's structures, while the EEG electrodes capture electrical signals from the brain's surface. By overlaying EEG electrodes onto the MRI image, researchers and clinicians can correlate brain activity with specific brain regions.
You can achieve this overlay in Matplotlib by plotting the MRI image using the imshow() function and then superimposing the EEG electrode positions using symbols or markers.
Example
The following example generates an MRI image and overlays EEG electrode positions on a single MRI slice using Matplotlib −
import matplotlib.pyplot as plt
import numpy as np

# Generating synthetic MRI data
mri_shape = (100, 100, 100)
mri_data = np.random.rand(*mri_shape)

# Generating sample EEG electrode positions (x, y coordinates)
eeg_electrodes = np.array([[30, 40], [50, 60], [70, 80]])

# Displaying a single MRI slice
plt.imshow(mri_data[:, :, 50], cmap='gray')

# Overlaying EEG electrode positions
plt.scatter(eeg_electrodes[:, 0], eeg_electrodes[:, 1], color='red', marker='o', label='EEG Electrodes')

# Adding legend
plt.legend()

# Adding title and axis labels
plt.title('MRI Slice with EEG Electrodes')
plt.xlabel('X')
plt.ylabel('Y')

# Displaying plot
plt.show()
Output
After executing the above code, we get the following output −
To Continue Learning Please Login