- Matplotlib Basics
- Matplotlib - Home
- Matplotlib - Introduction
- Matplotlib - Vs Seaborn
- Matplotlib - Environment Setup
- Matplotlib - Anaconda distribution
- Matplotlib - Jupyter Notebook
- Matplotlib - Pyplot API
- Matplotlib - Simple Plot
- Matplotlib - Saving Figures
- Matplotlib - Markers
- Matplotlib - Figures
- Matplotlib - Styles
- Matplotlib - Legends
- Matplotlib - Colors
- Matplotlib - Colormaps
- Matplotlib - Colormap Normalization
- Matplotlib - Choosing Colormaps
- Matplotlib - Colorbars
- Matplotlib - Text
- Matplotlib - Text properties
- Matplotlib - Subplot Titles
- Matplotlib - Images
- Matplotlib - Image Masking
- Matplotlib - Annotations
- Matplotlib - Arrows
- Matplotlib - Fonts
- Matplotlib - What are Fonts?
- Setting Font Properties Globally
- Matplotlib - Font Indexing
- Matplotlib - Mathematical Expressions
- Matplotlib - Transforms
- Matplotlib - Ticks and Tick Labels
- Matplotlib - Axis Ranges
- Matplotlib - Axis Scales
- Matplotlib - Axis Ticks
- Matplotlib - Formatting Axes
- Matplotlib - Axes Class
- Matplotlib - Twin Axes
- Matplotlib - Figure Class
- Matplotlib - Multiplots
- Matplotlib - Grids
- Matplotlib - Object-oriented Interface
- Matplotlib - PyLab module
- Matplotlib - Subplots() Function
- Matplotlib - Subplot2grid() Function
- Matplotlib - Anchored Artists
- Matplotlib - Manual Contour
- Matplotlib - Coords Report
- Matplotlib - AGG filter
- Matplotlib - Ribbon Box
- Matplotlib - Fill Spiral
- Matplotlib - Findobj Demo
- Matplotlib - Hyperlinks
- Matplotlib - Image Thumbnail
- Matplotlib - Plotting with Keywords
- Matplotlib - Create Logo
- Matplotlib - Multipage PDF
- Matplotlib - Multiprocessing
- Matplotlib - Print Stdout
- Matplotlib - Compound Path
- Matplotlib - Sankey Class
- Matplotlib - MRI with EEG
- Matplotlib - Stylesheets
- Matplotlib - Background Colors
- Matplotlib - Basemap
- Matplotlib Event Handling
- Matplotlib - Event Handling
- Matplotlib - Close Event
- Matplotlib - Mouse Move
- Matplotlib - Click Events
- Matplotlib - Scroll Event
- Matplotlib - Keypress Event
- Matplotlib - Pick Event
- Matplotlib - Looking Glass
- Matplotlib - Path Editor
- Matplotlib - Poly Editor
- Matplotlib - Timers
- Matplotlib - Viewlims
- Matplotlib - Zoom Window
- Matplotlib Plotting
- Matplotlib - Bar Graphs
- Matplotlib - Histogram
- Matplotlib - Pie Chart
- Matplotlib - Scatter Plot
- Matplotlib - Box Plot
- Matplotlib - Violin Plot
- Matplotlib - Contour Plot
- Matplotlib - 3D Plotting
- Matplotlib - 3D Contours
- Matplotlib - 3D Wireframe Plot
- Matplotlib - 3D Surface Plot
- Matplotlib - Quiver Plot
- Matplotlib Useful Resources
- Matplotlib - Quick Guide
- Matplotlib - Useful Resources
- Matplotlib - Discussion
Matplotlib - Print Stdout
Print − usually refers to displaying something, like text or numbers, on a screen or on paper.
stdout − stands for "standard output." It is a way for a program to send information (like text or data) out of itself. When a program "prints" something to stdout, it is essentially saying, "Here's some information I want to show or share".
So, when you hear "print stdout" together, it means a program is sending some information to be displayed in a standard way, usually on your screen. It is a basic method for programs to communicate with users or other parts of the computer system.
Print Stdout in Matplotlib
The term "print stdout" is not specific to Matplotlib. It generally refers to printing output to the standard output stream in Python, which is the console or terminal where you run your Python code.
In Matplotlib, if you want to print output to the console, you can use Python's built-in print() function. For example, you can print information about your plot, data, or any messages or debugging information.
Print Text on Plot
Printing text on a plot in Matplotlib allows you to add labels, titles, annotations, or any other textual information to enhance the understanding of your data visualization. You can place text at specific locations on the plot to provide explanations, highlight important points, or label different elements.
Example
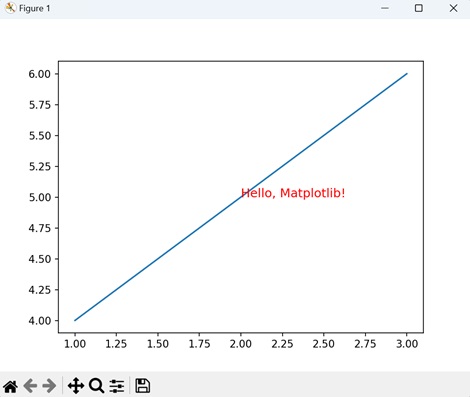
In the following example, we plot a line and add the text "Hello, Matplotlib!" to the plot using the text() function. We position the text at coordinates (2, 5) with a specified "fontsize" and "color" −
import matplotlib.pyplot as plt

# Creating a simple plot
plt.plot([1, 2, 3], [4, 5, 6])

# Adding text annotation to the plot
plt.text(2, 5, 'Hello, Matplotlib!', fontsize=12, color='red')

# Displaying the plot
plt.show()
Output
Following is the output of the above code −
Print Text on Polar Plot
Printing text on a polar plot in Matplotlib allows you to add labels, annotations, or any other textual information to enhance the understanding of your polar visualization. Just like in Cartesian plots, you can place text at specific locations on the polar plot to provide explanations, highlight important points, or label different elements.
Example
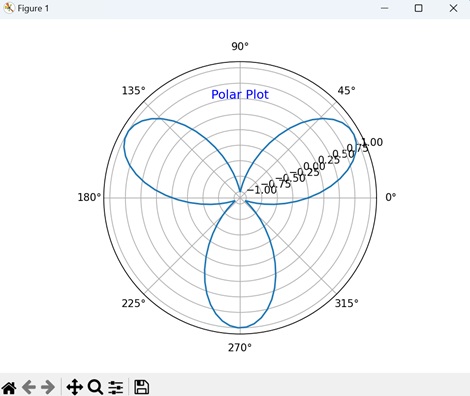
In here, we create a polar plot and add the text "Polar Plot" to the plot using the text() function. We position the text at an angle of "π/2" (90 degrees) and a radius of "0.5" from the origin, with a specified fontsize, color, and horizontal alignment −
import matplotlib.pyplot as plt
import numpy as np

# Creating a polar plot
theta = np.linspace(0, 2*np.pi, 100)
r = np.sin(3*theta)

plt.polar(theta, r)

# Adding text annotation to the polar plot
plt.text(np.pi/2, 0.5, 'Polar Plot', fontsize=12, color='blue', ha='center')

# Displaying the polar plot
plt.show()
Output
On executing the above code we will get the following output −
Print Text with Rotation
Printing text with rotation in Matplotlib allows you to display text at an angle, which can be useful for labeling elements with slanted or diagonal orientations, or for adding stylistic effects to your plots.
Example
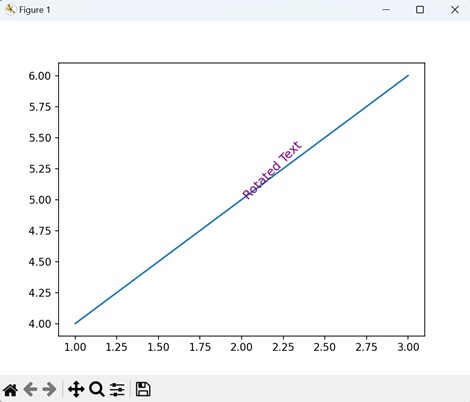
Now, we plot a line and add rotated text to the plot using the "rotation" parameter of the text() function. We position the text "Rotated Text" at coordinates (2, 5) with a specified fontsize, color, and rotation angle of "45" degrees −
import matplotlib.pyplot as plt

# Creating a simple plot
plt.plot([1, 2, 3], [4, 5, 6])

# Adding rotated text annotation to the plot
plt.text(2, 5, 'Rotated Text', fontsize=12, color='purple', rotation=45)

# Displaying the plot
plt.show()
Output
After executing the above code, we get the following output −
Print Text with Box
Printing text with a box in Matplotlib refers to adding textual annotations to a plot with a surrounding box, highlighting important information. These annotations can include labels, titles, or descriptions, and are enclosed within a rectangular or square-shaped box to draw attention to them.
To print text with a box around it in Matplotlib, you can use the "bbox" parameter of the text() function. This parameter allows you to specify the properties of the box, such as its color, transparency, and border width.
Example
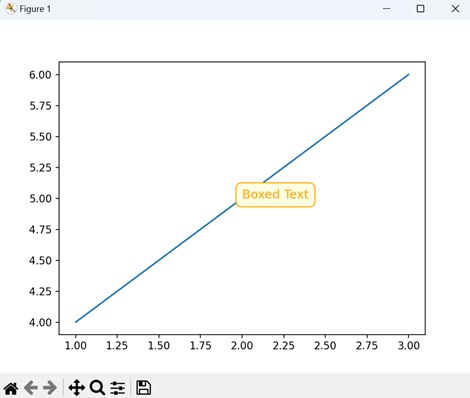
In the following example, we plot a line and add boxed text to the plot using the text() function. We position the text "Boxed Text" at coordinates (2, 5) with a specified fontsize, color, and a box with rounded corners, light yellow face color, and orange edge color −
import matplotlib.pyplot as plt

# Creating a simple plot
plt.plot([1, 2, 3], [4, 5, 6])

# Adding boxed text annotation to the plot
plt.text(2, 5, 'Boxed Text', fontsize=12, color='orange', bbox=dict(facecolor='lightyellow', edgecolor='orange', boxstyle='round,pad=0.5'))

# Displaying the plot
plt.show()
Output
On executing the above code we will get the following output −
To Continue Learning Please Login