- Matplotlib Basics
- Matplotlib - Home
- Matplotlib - Introduction
- Matplotlib - Vs Seaborn
- Matplotlib - Environment Setup
- Matplotlib - Anaconda distribution
- Matplotlib - Jupyter Notebook
- Matplotlib - Pyplot API
- Matplotlib - Simple Plot
- Matplotlib - Saving Figures
- Matplotlib - Markers
- Matplotlib - Figures
- Matplotlib - Styles
- Matplotlib - Legends
- Matplotlib - Colors
- Matplotlib - Colormaps
- Matplotlib - Colormap Normalization
- Matplotlib - Choosing Colormaps
- Matplotlib - Colorbars
- Matplotlib - Text
- Matplotlib - Text properties
- Matplotlib - Subplot Titles
- Matplotlib - Images
- Matplotlib - Image Masking
- Matplotlib - Annotations
- Matplotlib - Arrows
- Matplotlib - Fonts
- Matplotlib - What are Fonts?
- Setting Font Properties Globally
- Matplotlib - Font Indexing
- Matplotlib - Mathematical Expressions
- Matplotlib - Transforms
- Matplotlib - Ticks and Tick Labels
- Matplotlib - Axis Ranges
- Matplotlib - Axis Scales
- Matplotlib - Axis Ticks
- Matplotlib - Formatting Axes
- Matplotlib - Axes Class
- Matplotlib - Twin Axes
- Matplotlib - Figure Class
- Matplotlib - Multiplots
- Matplotlib - Grids
- Matplotlib - Object-oriented Interface
- Matplotlib - PyLab module
- Matplotlib - Subplots() Function
- Matplotlib - Subplot2grid() Function
- Matplotlib - Anchored Artists
- Matplotlib - Manual Contour
- Matplotlib - Coords Report
- Matplotlib - AGG filter
- Matplotlib - Ribbon Box
- Matplotlib - Fill Spiral
- Matplotlib - Findobj Demo
- Matplotlib - Hyperlinks
- Matplotlib - Image Thumbnail
- Matplotlib - Plotting with Keywords
- Matplotlib - Create Logo
- Matplotlib - Multipage PDF
- Matplotlib - Multiprocessing
- Matplotlib - Print Stdout
- Matplotlib - Compound Path
- Matplotlib - Sankey Class
- Matplotlib - MRI with EEG
- Matplotlib - Stylesheets
- Matplotlib - Background Colors
- Matplotlib - Basemap
- Matplotlib Event Handling
- Matplotlib - Event Handling
- Matplotlib - Close Event
- Matplotlib - Mouse Move
- Matplotlib - Click Events
- Matplotlib - Scroll Event
- Matplotlib - Keypress Event
- Matplotlib - Pick Event
- Matplotlib - Looking Glass
- Matplotlib - Path Editor
- Matplotlib - Poly Editor
- Matplotlib - Timers
- Matplotlib - Viewlims
- Matplotlib - Zoom Window
- Matplotlib Plotting
- Matplotlib - Bar Graphs
- Matplotlib - Histogram
- Matplotlib - Pie Chart
- Matplotlib - Scatter Plot
- Matplotlib - Box Plot
- Matplotlib - Violin Plot
- Matplotlib - Contour Plot
- Matplotlib - 3D Plotting
- Matplotlib - 3D Contours
- Matplotlib - 3D Wireframe Plot
- Matplotlib - 3D Surface Plot
- Matplotlib - Quiver Plot
- Matplotlib Useful Resources
- Matplotlib - Quick Guide
- Matplotlib - Useful Resources
- Matplotlib - Discussion
Matplotlib - Hyperlinks
A hyperlink, often referred to as a link, is a navigational element that present in various forms, such as text, images, icons, or buttons, within a document or on a webpage. When clicked or activated, a hyperlink redirects the user to a specified URL or resource, creating a seamless and interactive experience.
Matplotlib provides a variety of tools to include hyperlinks in plots. In this tutorial, you will explore how to add hyperlinks in Matplotlib plots, such as SVG figures and PdfPages.
Creating SVG figures with hyperlinks
SVG (known as Scalable Vector Graphics) is an XML-based image format that supports hyperlinks. However, it's crucial to note that hyperlinks in Matplotlib specifically apply to SVG output. If the plot is saved as a static image, such as PNG or JPEG, or is displayed as plot in a window, the hyperlink functionality will not be operational.
In such case, you can use this feature in interactive plots with clickable elements.
Example
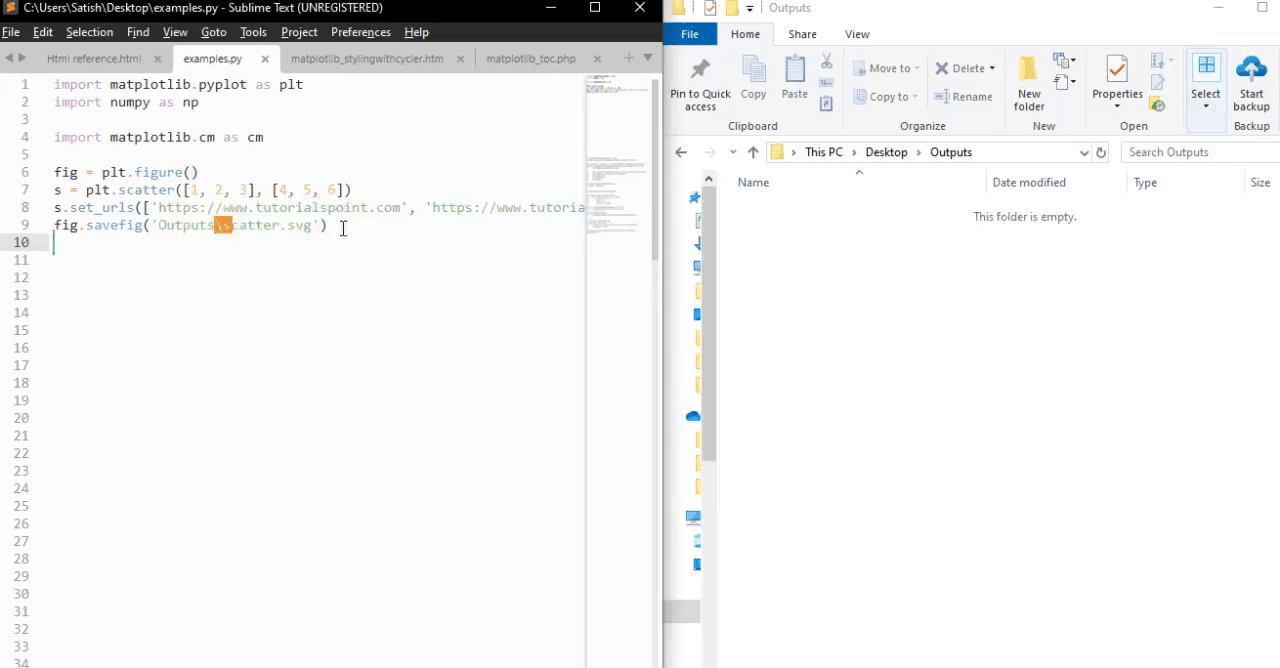
In this example, a scatter plot is created, and hyperlinks are assigned to individual data points using the set_urls method.
import matplotlib.pyplot as plt
import numpy as np

fig = plt.figure()
s = plt.scatter([1, 2, 3], [4, 5, 6])
s.set_urls(['https://www.tutorialspoint.com', 'https://www.tutorialspoint.com/matplotlib/index.htm', None])
fig.savefig('scatter.svg')
Output
After running the above code, you can check the output directory for the .svg image file.
Adding Hyperlinks in PdfPages
The PdfPages module in matplotlib enables the creation of multipage PDF documents. You can add hyperlinks to those pdf pages using the matplotlib text elements.
Example
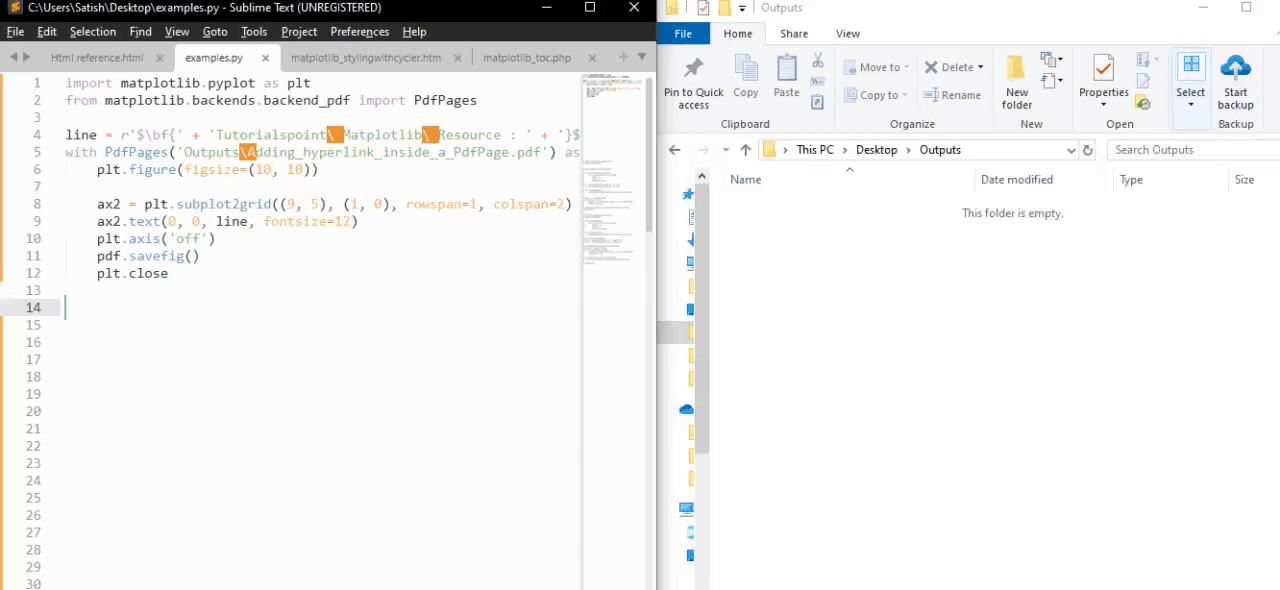
In this example, a PDF document is created using PdfPages, and a text element with a hyperlink is added to the plot.
import matplotlib.pyplot as plt
from matplotlib.backends.backend_pdf import PdfPages

msr_line4 = r'$\bf{' + 'Tutorialspoint\ Matplotlib\ Resource : ' + '}$' + "https://www.tutorialspoint.com/matplotlib/index.htm"
with PdfPages('Adding_hyperlink_inside_a_PdfPage.pdf') as pdf:
   plt.figure(figsize=(11, 8.5))

   ax2 = plt.subplot2grid((9, 5), (1, 0), rowspan=1, colspan=2)
   ax2.text(0, 0, msr_line4, fontsize=9)
   plt.axis('off')
   pdf.savefig()
   plt.close
Output
After running the above code, you can check the output directory for the .pdf file.
Hyperlinks in Interactive Plots
For plots that are not rendered as SVG, such as interactive plots displayed in a Matplotlib window, hyperlinks can be implemented using event handlers. By creating a function to handle the "pick" event, you can define actions to be taken when specific elements, like data points, are clicked.
Example
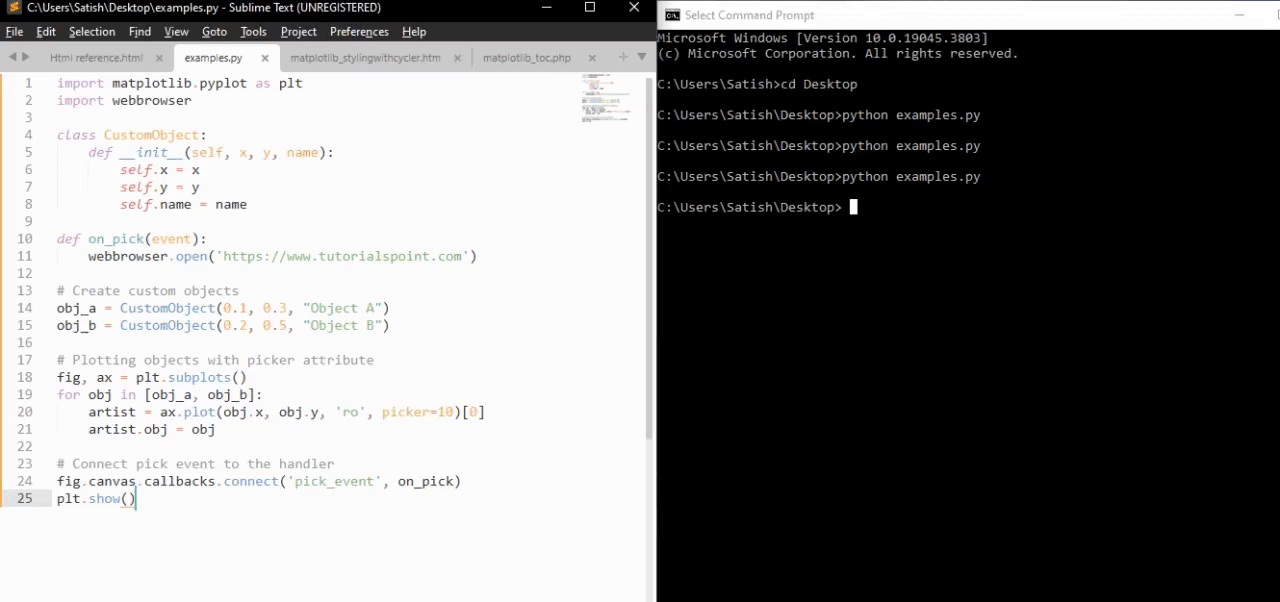
The following example demonstrates how to open a specified hyperlink in a web browser when clicking on a data point.
import matplotlib.pyplot as plt
import webbrowser

class CustomObject:
   def __init__(self, x, y, name):
      self.x = x
      self.y = y
      self.name = name

def on_pick(event):
   webbrowser.open('https://www.tutorialspoint.com')

# Create custom objects
obj_a = CustomObject(0.1, 0.3, "Object A")
obj_b = CustomObject(0.2, 0.5, "Object B")

# Plotting objects with picker attribute
fig, ax = plt.subplots()
for obj in [obj_a, obj_b]:
   artist = ax.plot(obj.x, obj.y, 'ro', picker=10)[0]
   artist.obj = obj

# Connect pick event to the handler
fig.canvas.callbacks.connect('pick_event', on_pick)

plt.show()
Output
See the below video for how the output looks like.
To Continue Learning Please Login