- Matplotlib Basics
- Matplotlib - Home
- Matplotlib - Introduction
- Matplotlib - Vs Seaborn
- Matplotlib - Environment Setup
- Matplotlib - Anaconda distribution
- Matplotlib - Jupyter Notebook
- Matplotlib - Pyplot API
- Matplotlib - Simple Plot
- Matplotlib - Saving Figures
- Matplotlib - Markers
- Matplotlib - Figures
- Matplotlib - Styles
- Matplotlib - Legends
- Matplotlib - Colors
- Matplotlib - Colormaps
- Matplotlib - Colormap Normalization
- Matplotlib - Choosing Colormaps
- Matplotlib - Colorbars
- Matplotlib - Text
- Matplotlib - Text properties
- Matplotlib - Subplot Titles
- Matplotlib - Images
- Matplotlib - Image Masking
- Matplotlib - Annotations
- Matplotlib - Arrows
- Matplotlib - Fonts
- Matplotlib - What are Fonts?
- Setting Font Properties Globally
- Matplotlib - Font Indexing
- Matplotlib - Mathematical Expressions
- Matplotlib - Transforms
- Matplotlib - Ticks and Tick Labels
- Matplotlib - Axis Ranges
- Matplotlib - Axis Scales
- Matplotlib - Axis Ticks
- Matplotlib - Formatting Axes
- Matplotlib - Axes Class
- Matplotlib - Twin Axes
- Matplotlib - Figure Class
- Matplotlib - Multiplots
- Matplotlib - Grids
- Matplotlib - Object-oriented Interface
- Matplotlib - PyLab module
- Matplotlib - Subplots() Function
- Matplotlib - Subplot2grid() Function
- Matplotlib - Anchored Artists
- Matplotlib - Manual Contour
- Matplotlib - Coords Report
- Matplotlib - AGG filter
- Matplotlib - Ribbon Box
- Matplotlib - Fill Spiral
- Matplotlib - Findobj Demo
- Matplotlib - Hyperlinks
- Matplotlib - Image Thumbnail
- Matplotlib - Plotting with Keywords
- Matplotlib - Create Logo
- Matplotlib - Multipage PDF
- Matplotlib - Multiprocessing
- Matplotlib - Print Stdout
- Matplotlib - Compound Path
- Matplotlib - Sankey Class
- Matplotlib - MRI with EEG
- Matplotlib - Stylesheets
- Matplotlib - Background Colors
- Matplotlib - Basemap
- Matplotlib Event Handling
- Matplotlib - Event Handling
- Matplotlib - Close Event
- Matplotlib - Mouse Move
- Matplotlib - Click Events
- Matplotlib - Scroll Event
- Matplotlib - Keypress Event
- Matplotlib - Pick Event
- Matplotlib - Looking Glass
- Matplotlib - Path Editor
- Matplotlib - Poly Editor
- Matplotlib - Timers
- Matplotlib - Viewlims
- Matplotlib - Zoom Window
- Matplotlib Plotting
- Matplotlib - Bar Graphs
- Matplotlib - Histogram
- Matplotlib - Pie Chart
- Matplotlib - Scatter Plot
- Matplotlib - Box Plot
- Matplotlib - Violin Plot
- Matplotlib - Contour Plot
- Matplotlib - 3D Plotting
- Matplotlib - 3D Contours
- Matplotlib - 3D Wireframe Plot
- Matplotlib - 3D Surface Plot
- Matplotlib - Quiver Plot
- Matplotlib Useful Resources
- Matplotlib - Quick Guide
- Matplotlib - Useful Resources
- Matplotlib - Discussion
Matplotlib - Multicursor
Introduction
Matplotlib does not have a dedicated Multicursor widget. However Matplotlib provides the Cursor widget which can be used to add a cursor to a plot for displaying information at a specific location. Additionally the matplotlib.widgets module offers a tool called MultiCursor that allows us to have multiple cursor lines in a single plot. This can be useful for comparing values at different points along the x-axis.
Let's explore how to use the MultiCursor tool along with the Cursor widget in Matplotlib and discuss its features, implementation and potential use cases.
Features of MultiCursor
The following are the features of the Multicursor widget.
Multiple Cursors − The MultiCursor tool in Matplotlib allows us to add multiple cursor lines to a single plot. Each cursor line corresponds to a specific set of axes.
Coordination between Cursors − The cursors are linked i.e. they move together when interacting with one of them. This facilitates easy comparison of data points across different axes.
Customizable Appearance − The appearance of the cursors such as line color and linestyle can be customized based on our preferences.
Dynamic Data Display − As we move the cursors along the x-axis the corresponding y-values at the cursor position are dynamically displayed by providing real-time information.
Basic Cursor Example
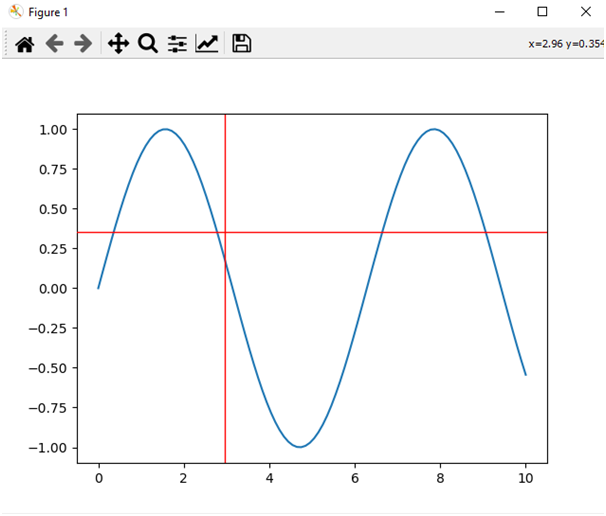
Here's a basic example demonstrating the usage of the Cursor class.
Example
import matplotlib.pyplot as plt
from matplotlib.widgets import Cursor
import numpy as np
# Generating sample data
x = np.linspace(0, 10, 100)
y = np.sin(x)
# Creating a plot
fig, ax = plt.subplots()
line, = ax.plot(x, y, label='Sine Wave')
# Adding a cursor to the plot
cursor = Cursor(ax, horizOn=True, vertOn=True, useblit=True, color='red', linewidth=1)
# Displaying the plot
plt.show()
Output
Using mplcursors for Multicursor
To implement a multicursor in Matplotlib we can use the mplcursors package which provides additional cursor functionalities. We can install the mplcursors package by using the below line of code.
Example
pip install mplcursors
Output
Collecting mplcursors
   Downloading mplcursors-0.5.3.tar.gz (88 kB)
      -------------------------------------- 88.8/88.8 kB 557.3 kB/s eta 0:00:00
   Installing build dependencies: started
   Installing build dependencies: finished with status 'done'
   Getting requirements to build wheel: started
   Getting requirements to build wheel: finished with status 'done'
   Installing backend dependencies: started
   Installing backend dependencies: finished with status 'done'
   Preparing metadata (pyproject.toml): started
   Preparing metadata (pyproject.toml): finished with status 'done'
Usage of mplcursors
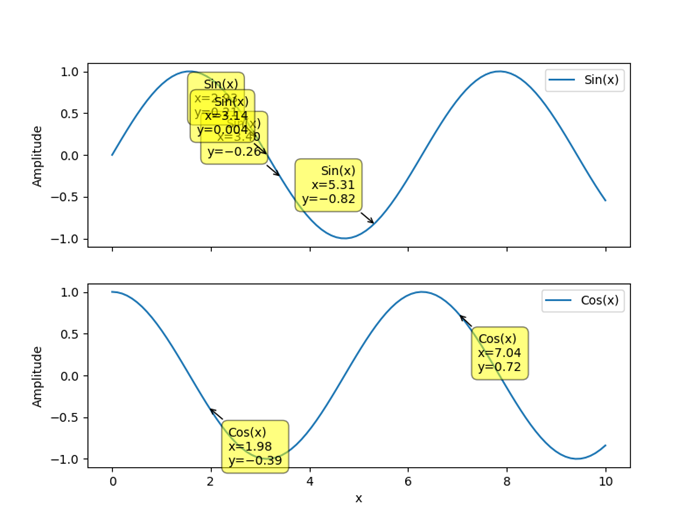
Now let's explore an example using mplcursors to create a multicursor in Matplotlib.
Example
import matplotlib.pyplot as plt
import mplcursors
import numpy as np
# Generate sample data
x = np.linspace(0, 10, 100)
y1 = np.sin(x)
y2 = np.cos(x)
# Create subplots
fig, (ax1, ax2) = plt.subplots(2, 1, sharex=True, figsize=(8, 6))
# Plot data on the first subplot
ax1.plot(x, y1, label='Sin(x)')
ax1.set_ylabel('Amplitude')
ax1.legend()
# Plot data on the second subplot
ax2.plot(x, y2, label='Cos(x)')
ax2.set_xlabel('x')
ax2.set_ylabel('Amplitude')
ax2.legend()
# Enable multicursor on both subplots
mplcursors.cursor(hover=True, multiple=True)
# Display the plot
plt.show()
Output
Extending to Multi-Cursor
To extend this concept to a true multi-cursor scenario where multiple cursors move independently we would need to create separate instances of the Cursor class for each line or data source and update the information accordingly.
Use Cases for Multicursor
The following are the use cases of the multicursor widget usage.
Comparative Analysis − Multicursors are beneficial when comparing corresponding data points between different plots which aids in visualizing relationships.
Time Series Exploration − For time series data the multicursors allow simultaneous inspection of values at specific time points across multiple time series.
Interactive Data Exploration − Multicursors enhance the interactivity of data visualizations by allowing users to explore data points across different dimensions.
Correlation Analysis − When studying the correlation between two or more variables then multicursors assist in identifying patterns and correlations.
To Continue Learning Please Login