- Matplotlib Basics
- Matplotlib - Home
- Matplotlib - Introduction
- Matplotlib - Vs Seaborn
- Matplotlib - Environment Setup
- Matplotlib - Anaconda distribution
- Matplotlib - Jupyter Notebook
- Matplotlib - Pyplot API
- Matplotlib - Simple Plot
- Matplotlib - Saving Figures
- Matplotlib - Markers
- Matplotlib - Figures
- Matplotlib - Styles
- Matplotlib - Legends
- Matplotlib - Colors
- Matplotlib - Colormaps
- Matplotlib - Colormap Normalization
- Matplotlib - Choosing Colormaps
- Matplotlib - Colorbars
- Matplotlib - Text
- Matplotlib - Text properties
- Matplotlib - Subplot Titles
- Matplotlib - Images
- Matplotlib - Image Masking
- Matplotlib - Annotations
- Matplotlib - Arrows
- Matplotlib - Fonts
- Matplotlib - What are Fonts?
- Setting Font Properties Globally
- Matplotlib - Font Indexing
- Matplotlib - Mathematical Expressions
- Matplotlib - Transforms
- Matplotlib - Ticks and Tick Labels
- Matplotlib - Axis Ranges
- Matplotlib - Axis Scales
- Matplotlib - Axis Ticks
- Matplotlib - Formatting Axes
- Matplotlib - Axes Class
- Matplotlib - Twin Axes
- Matplotlib - Figure Class
- Matplotlib - Multiplots
- Matplotlib - Grids
- Matplotlib - Object-oriented Interface
- Matplotlib - PyLab module
- Matplotlib - Subplots() Function
- Matplotlib - Subplot2grid() Function
- Matplotlib - Anchored Artists
- Matplotlib - Manual Contour
- Matplotlib - Coords Report
- Matplotlib - AGG filter
- Matplotlib - Ribbon Box
- Matplotlib - Fill Spiral
- Matplotlib - Findobj Demo
- Matplotlib - Hyperlinks
- Matplotlib - Image Thumbnail
- Matplotlib - Plotting with Keywords
- Matplotlib - Create Logo
- Matplotlib - Multipage PDF
- Matplotlib - Multiprocessing
- Matplotlib - Print Stdout
- Matplotlib - Compound Path
- Matplotlib - Sankey Class
- Matplotlib - MRI with EEG
- Matplotlib - Stylesheets
- Matplotlib - Background Colors
- Matplotlib - Basemap
- Matplotlib Event Handling
- Matplotlib - Event Handling
- Matplotlib - Close Event
- Matplotlib - Mouse Move
- Matplotlib - Click Events
- Matplotlib - Scroll Event
- Matplotlib - Keypress Event
- Matplotlib - Pick Event
- Matplotlib - Looking Glass
- Matplotlib - Path Editor
- Matplotlib - Poly Editor
- Matplotlib - Timers
- Matplotlib - Viewlims
- Matplotlib - Zoom Window
- Matplotlib Plotting
- Matplotlib - Bar Graphs
- Matplotlib - Histogram
- Matplotlib - Pie Chart
- Matplotlib - Scatter Plot
- Matplotlib - Box Plot
- Matplotlib - Violin Plot
- Matplotlib - Contour Plot
- Matplotlib - 3D Plotting
- Matplotlib - 3D Contours
- Matplotlib - 3D Wireframe Plot
- Matplotlib - 3D Surface Plot
- Matplotlib - Quiver Plot
- Matplotlib Useful Resources
- Matplotlib - Quick Guide
- Matplotlib - Useful Resources
- Matplotlib - Discussion
Matplotlib - Plotting with Keywords
Plotting with keywords generally refers to using specific words or commands to customize and control how data is displayed in a plot or graph.
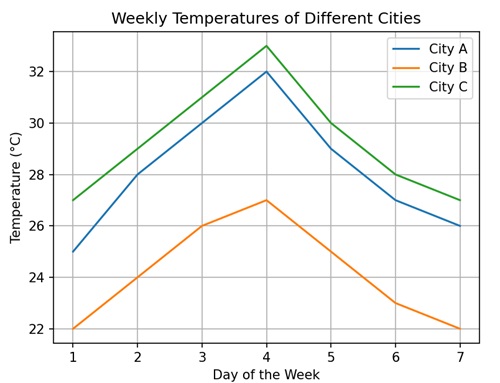
Imagine you have some data, like the temperatures of different cities over a week. You want to create a graph to show this data, but you also want to make it look nice and informative. Plotting with keywords allows you to do just that.
Instead of manually specifying every little detail of the plot, like the color of the lines, the labels on the axes, or the size of the points, you can use keywords or commands to tell the plotting software what you want.
For example, you might use a keyword like "color" followed by a specific color name to change the color of a line in your plot. Or you might use "xlabel" and "ylabel" to add labels to the x-axis and y-axis respectively.
Plotting with Keywords in Matplotlib
When you create a plot using Matplotlib, you can use keywords to control various aspects of the plot, such as the color, line style, marker style, labels, titles, and many other attributes. Instead of providing numerical values or configurations directly, you specify these attributes using descriptive keywords.
For example, to add labels to the x-axis and y-axis, you can use the keywords "xlabel" and "ylabel", respectively.
Plotting with Keyword "Color"
When plotting in Matplotlib, you can use the "color" keyword argument to specify the color of the elements you are drawing. You can specify colors in several ways −
Named Colors − You can use common color names such as "red", "blue", "green", etc., to specify colors.
Hexadecimal Colors − You can use hexadecimal color codes (e.g., "#FF5733") to specify precise colors.
RGB or RGBA Colors − You can specify colors using RGB or RGBA values, where R stands for red, G for green, B for blue, and A for alpha (opacity).
Example
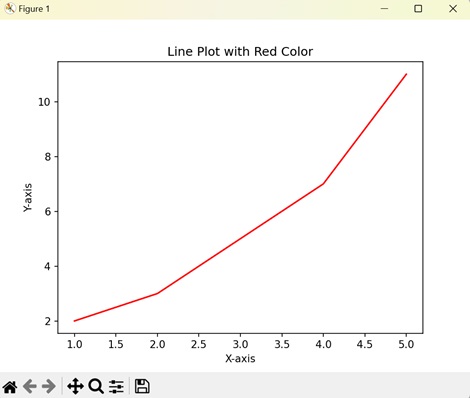
In the following example, we are creating a line plot where the line color is changed to red using the "color" keyword −
import matplotlib.pyplot as plt

# Data
x = [1, 2, 3, 4, 5]
y = [2, 3, 5, 7, 11]

# Changing line color to red
plt.plot(x, y, color='red')

# Customizing Plot
plt.title('Line Plot with Red Color')
plt.xlabel('X-axis')
plt.ylabel('Y-axis')

# Displaying Plot
plt.show()
Output
Following is the output of the above code −
Plotting with Keyword "marker"
In Matplotlib, plotting with the keyword "marker" is used to specify the symbols or markers used to denote individual data points on a plot.
When you create a scatter plot or line plot in Matplotlib, each data point can be represented by a marker, which is a small symbol or shape. The "marker" keyword allows you to choose the shape, size, and color of these markers. Common marker options include circles, squares, triangles, and dots.
Example
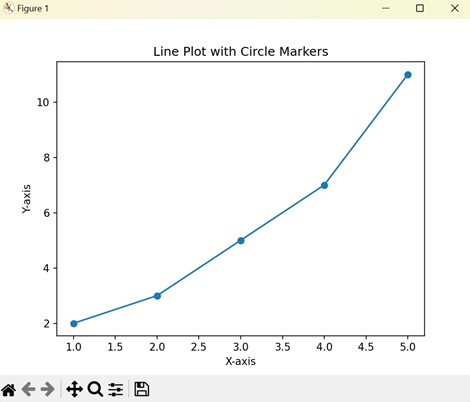
In here, we are using the "marker" keyword to add circle markers to the data points on the line plot −
import matplotlib.pyplot as plt

# Data
x = [1, 2, 3, 4, 5]
y = [2, 3, 5, 7, 11]

# Adding circle markers
plt.plot(x, y, marker='o')

# Customizing Plot
plt.title('Line Plot with Circle Markers')
plt.xlabel('X-axis')
plt.ylabel('Y-axis')

# Displaying Plot
plt.show()
Output
On executing the above code we will get the following output −
Plotting with Keyword "linestyle"
In Matplotlib, plotting with the keyword "linestyle" is used to specify the style of the lines connecting data points in a plot.
When you create a line plot in Matplotlib, each data point is connected by a line. The "linestyle" keyword allows you to choose the style of these lines. Common linestyle options include solid lines, dashed lines, dotted lines, and dash-dot lines. You can specify these styles using strings such as "-", "--", ":", and "-." respectively.
Example
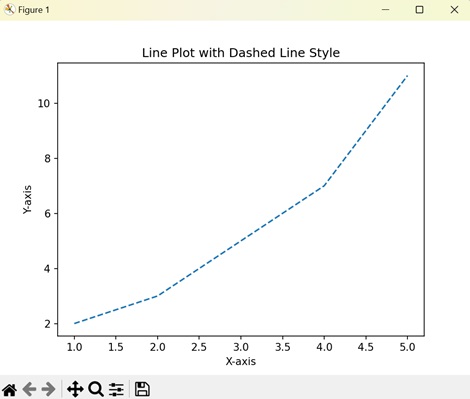
Now, we are using the "linestyle" keyword to change the line style to "dashed" −
import matplotlib.pyplot as plt

# Data
x = [1, 2, 3, 4, 5]
y = [2, 3, 5, 7, 11]

# Changing line style to dashed
plt.plot(x, y, linestyle='--')

# Customizing Plot
plt.title('Line Plot with Dashed Line Style')
plt.xlabel('X-axis')
plt.ylabel('Y-axis')

# Displaying Plot
plt.show()
Output
After executing the above code, we get the following output −
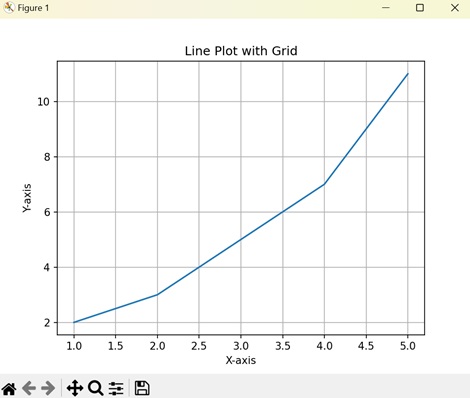
Plotting with Keyword "grid"
In Matplotlib, plotting with the keyword "grid" is used to add gridlines to your plot. Gridlines are horizontal and vertical lines that help in visually aligning data points on the plot.
The "grid" keyword allows you to control whether gridlines are displayed on the plot. You can specify whether you want gridlines along the x-axis, y-axis, or both axes. When you enable the gridlines, they appear as faint lines spanning the plot area, forming a grid-like pattern.
Example
In the following example, we are using the "grid" keyword to add a grid to the plot −
import matplotlib.pyplot as plt

# Data
x = [1, 2, 3, 4, 5]
y = [2, 3, 5, 7, 11]

# Plotting
plt.plot(x, y)

# Customizing Plot
plt.title('Line Plot with Grid')
plt.xlabel('X-axis')
plt.ylabel('Y-axis')
# Adding grid
plt.grid(True)

# Displaying Plot
plt.show()
Output
On executing the above code we will get the following output −
To Continue Learning Please Login