- Matplotlib Basics
- Matplotlib - Home
- Matplotlib - Introduction
- Matplotlib - Vs Seaborn
- Matplotlib - Environment Setup
- Matplotlib - Anaconda distribution
- Matplotlib - Jupyter Notebook
- Matplotlib - Pyplot API
- Matplotlib - Simple Plot
- Matplotlib - Saving Figures
- Matplotlib - Markers
- Matplotlib - Figures
- Matplotlib - Styles
- Matplotlib - Legends
- Matplotlib - Colors
- Matplotlib - Colormaps
- Matplotlib - Colormap Normalization
- Matplotlib - Choosing Colormaps
- Matplotlib - Colorbars
- Matplotlib - Text
- Matplotlib - Text properties
- Matplotlib - Subplot Titles
- Matplotlib - Images
- Matplotlib - Image Masking
- Matplotlib - Annotations
- Matplotlib - Arrows
- Matplotlib - Fonts
- Matplotlib - What are Fonts?
- Setting Font Properties Globally
- Matplotlib - Font Indexing
- Matplotlib - Mathematical Expressions
- Matplotlib - Transforms
- Matplotlib - Ticks and Tick Labels
- Matplotlib - Axis Ranges
- Matplotlib - Axis Scales
- Matplotlib - Axis Ticks
- Matplotlib - Formatting Axes
- Matplotlib - Axes Class
- Matplotlib - Twin Axes
- Matplotlib - Figure Class
- Matplotlib - Multiplots
- Matplotlib - Grids
- Matplotlib - Object-oriented Interface
- Matplotlib - PyLab module
- Matplotlib - Subplots() Function
- Matplotlib - Subplot2grid() Function
- Matplotlib - Anchored Artists
- Matplotlib - Manual Contour
- Matplotlib - Coords Report
- Matplotlib - AGG filter
- Matplotlib - Ribbon Box
- Matplotlib - Fill Spiral
- Matplotlib - Findobj Demo
- Matplotlib - Hyperlinks
- Matplotlib - Image Thumbnail
- Matplotlib - Plotting with Keywords
- Matplotlib - Create Logo
- Matplotlib - Multipage PDF
- Matplotlib - Multiprocessing
- Matplotlib - Print Stdout
- Matplotlib - Compound Path
- Matplotlib - Sankey Class
- Matplotlib - MRI with EEG
- Matplotlib - Stylesheets
- Matplotlib - Background Colors
- Matplotlib - Basemap
- Matplotlib Event Handling
- Matplotlib - Event Handling
- Matplotlib - Close Event
- Matplotlib - Mouse Move
- Matplotlib - Click Events
- Matplotlib - Scroll Event
- Matplotlib - Keypress Event
- Matplotlib - Pick Event
- Matplotlib - Looking Glass
- Matplotlib - Path Editor
- Matplotlib - Poly Editor
- Matplotlib - Timers
- Matplotlib - Viewlims
- Matplotlib - Zoom Window
- Matplotlib Plotting
- Matplotlib - Bar Graphs
- Matplotlib - Histogram
- Matplotlib - Pie Chart
- Matplotlib - Scatter Plot
- Matplotlib - Box Plot
- Matplotlib - Violin Plot
- Matplotlib - Contour Plot
- Matplotlib - 3D Plotting
- Matplotlib - 3D Contours
- Matplotlib - 3D Wireframe Plot
- Matplotlib - 3D Surface Plot
- Matplotlib - Quiver Plot
- Matplotlib Useful Resources
- Matplotlib - Quick Guide
- Matplotlib - Useful Resources
- Matplotlib - Discussion
Matplotlib - Stylesheets
What are StyleSheets?
In Matplotlib library stylesheets are predefined sets of aesthetic configurations that control the overall appearance of plots. They offer a convenient way to change the look and feel of our plots with minimal effort.
A stylesheet consists of predefined settings for various elements of a plot such as colors, line styles, fonts, grid styles and much more. Matplotlib provides a collection of built-in stylesheets that allow us to quickly apply different visual themes to our plots.
The default style is used when no specific style is set but Matplotlib includes several other styles like gplot, seaborn, bmh, dark_background and more. These stylesheets offer different color schemes, line styles, font settings and overall aesthetics.
Matplotlib provides a variety of built-in stylesheets. Here's an overview of how you can work with them −
Viewing Available Stylesheets
Matplotlib provides different stylesheets that change the overall appearance of plots and altering elements such as colors, line styles, font sizes etc. Stylesheets offer a quick and easy way to change the aesthetics of our visualizations.
Syntax
We can check the available stylesheets using the below syntax.
plt.style.available
Example
Here in this example we are using the plt.style.available to get all the available stylesheets in the Matplotlib library.
import matplotlib.pyplot as plt
# List available stylesheets
print("Available stylesheets:", plt.style.available)
Output
Available stylesheets: [
   'Solarize_Light2', '_classic_test_patch',
   '_mpl-gallery', '_mpl-gallery-nogrid', 'bmh', 'classic',
   'dark_background', 'fast', 'fivethirtyeight',
   'ggplot', 'grayscale', 'seaborn', 'seaborn-bright',
   'seaborn-colorblind', 'seaborn-dark',
   'seaborn-dark-palette', 'seaborn-darkgrid',
   'seaborn-deep', 'seaborn-muted', 'seaborn-notebook',
   'seaborn-paper', 'seaborn-pastel', 'seaborn-poster',
   'seaborn-talk', 'seaborn-ticks', 'seaborn-white',
   'seaborn-whitegrid', 'tableau-colorblind10']
Using Stylesheets
Absolutely to use the Matplotlib stylesheets is straightforward. We can apply a specific style to our plots. Here's the syntax.
Syntax
plt.style.use('stylesheet_name')
Where,
plt.style.use() − This is used to use the defined stylesheets to the entire plot.
stylesheet_name − This is the name of the stylesheet that we want to apply.
Example
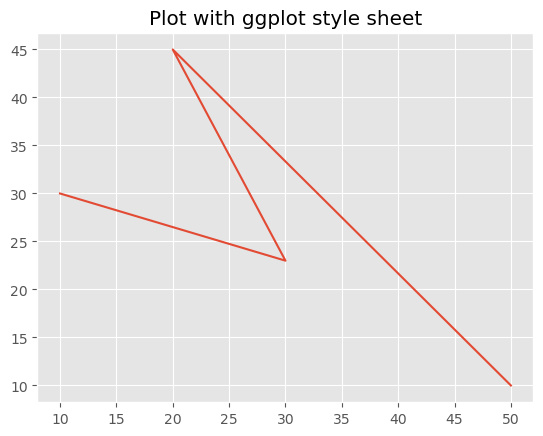
In this example we are using the stylesheet ‘ggplot’ by employing the plt.style.use('ggplot') before creating our plot.
import matplotlib.pyplot as plt
# Using a specific stylesheet
plt.style.use('ggplot')  # Example: Using the 'ggplot' style
x = [10,30,20,50]
y = [30,23,45,10]
plt.plot(x,y)
plt.title("Plot with ggplot style sheet")
plt.show()
Output
Applying Stylesheet Temporarily
If we want to apply a stylesheet temporarily to a specific block of code without affecting other plots we can use with plt.style.context('stylesheet_name').
This temporary context applies the specified style only within the block of code indented under the with statement.
Example
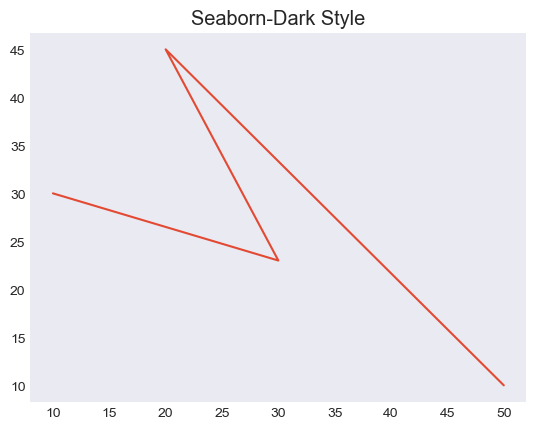
In this example we are setting the stylesheet to seaborn-dark by using the plt.style.context() functin available in matplotlib library.
import matplotlib.pyplot as plt
x = [10,30,20,50]
y = [30,23,45,10]
with plt.style.context('seaborn-dark'):
   # Code for a plot with 'seaborn-dark' style
   plt.plot(x, y)
   plt.title('Seaborn-Dark Style')
   plt.show()  # The 'seaborn-dark' style will only affect this plot
Output
Creating Custom Stylesheets
We can also create our custom stylesheets by defining a .mplstyle file or using a Python dictionary specifying the style parameters −
Example
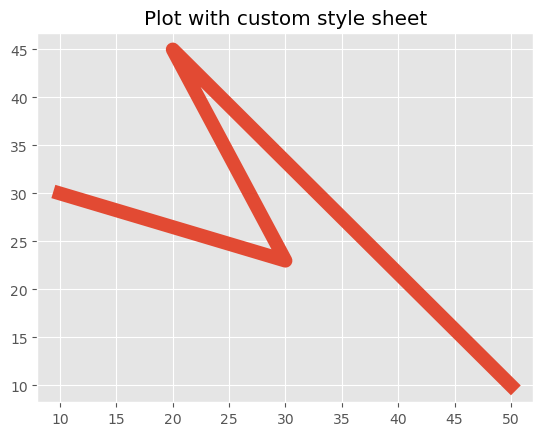
In this example we are creating the custom stylesheets by using the dictionary.
import matplotlib.pyplot as plt
# Define a custom style using a dictionary
custom_style = {
   'lines.linewidth': 10,
   'lines.color': 'red',
   'axes.labelsize': 30,
   # Add more style configurations as needed
}
# Use the custom style
plt.style.use(custom_style)
x = [10,30,20,50]
y = [30,23,45,10]
plt.plot(x,y)
plt.title("Plot with custom style sheet")
plt.show()
Output
Stylesheets offer an efficient way to maintain consistency across multiple plots or to experiment with various visual styles easily. We can select stylesheets that best suit our preferences or the specific requirements of our data visualization.
To Continue Learning Please Login