- Matplotlib Basics
- Matplotlib - Home
- Matplotlib - Introduction
- Matplotlib - Vs Seaborn
- Matplotlib - Environment Setup
- Matplotlib - Anaconda distribution
- Matplotlib - Jupyter Notebook
- Matplotlib - Pyplot API
- Matplotlib - Simple Plot
- Matplotlib - Saving Figures
- Matplotlib - Markers
- Matplotlib - Figures
- Matplotlib - Styles
- Matplotlib - Legends
- Matplotlib - Colors
- Matplotlib - Colormaps
- Matplotlib - Colormap Normalization
- Matplotlib - Choosing Colormaps
- Matplotlib - Colorbars
- Matplotlib - Text
- Matplotlib - Text properties
- Matplotlib - Subplot Titles
- Matplotlib - Images
- Matplotlib - Image Masking
- Matplotlib - Annotations
- Matplotlib - Arrows
- Matplotlib - Fonts
- Matplotlib - What are Fonts?
- Setting Font Properties Globally
- Matplotlib - Font Indexing
- Matplotlib - Mathematical Expressions
- Matplotlib - Transforms
- Matplotlib - Ticks and Tick Labels
- Matplotlib - Axis Ranges
- Matplotlib - Axis Scales
- Matplotlib - Axis Ticks
- Matplotlib - Formatting Axes
- Matplotlib - Axes Class
- Matplotlib - Twin Axes
- Matplotlib - Figure Class
- Matplotlib - Multiplots
- Matplotlib - Grids
- Matplotlib - Object-oriented Interface
- Matplotlib - PyLab module
- Matplotlib - Subplots() Function
- Matplotlib - Subplot2grid() Function
- Matplotlib - Anchored Artists
- Matplotlib - Manual Contour
- Matplotlib - Coords Report
- Matplotlib - AGG filter
- Matplotlib - Ribbon Box
- Matplotlib - Fill Spiral
- Matplotlib - Findobj Demo
- Matplotlib - Hyperlinks
- Matplotlib - Image Thumbnail
- Matplotlib - Plotting with Keywords
- Matplotlib - Create Logo
- Matplotlib - Multipage PDF
- Matplotlib - Multiprocessing
- Matplotlib - Print Stdout
- Matplotlib - Compound Path
- Matplotlib - Sankey Class
- Matplotlib - MRI with EEG
- Matplotlib - Stylesheets
- Matplotlib - Background Colors
- Matplotlib - Basemap
- Matplotlib Event Handling
- Matplotlib - Event Handling
- Matplotlib - Close Event
- Matplotlib - Mouse Move
- Matplotlib - Click Events
- Matplotlib - Scroll Event
- Matplotlib - Keypress Event
- Matplotlib - Pick Event
- Matplotlib - Looking Glass
- Matplotlib - Path Editor
- Matplotlib - Poly Editor
- Matplotlib - Timers
- Matplotlib - Viewlims
- Matplotlib - Zoom Window
- Matplotlib Plotting
- Matplotlib - Bar Graphs
- Matplotlib - Histogram
- Matplotlib - Pie Chart
- Matplotlib - Scatter Plot
- Matplotlib - Box Plot
- Matplotlib - Violin Plot
- Matplotlib - Contour Plot
- Matplotlib - 3D Plotting
- Matplotlib - 3D Contours
- Matplotlib - 3D Wireframe Plot
- Matplotlib - 3D Surface Plot
- Matplotlib - Quiver Plot
- Matplotlib Useful Resources
- Matplotlib - Quick Guide
- Matplotlib - Useful Resources
- Matplotlib - Discussion
Matplotlib - Cursor Widget
What is Cursor Widget?
The Matplotlib Cursor Widget is specifically the Cursor class in Matplotlib's widgets module. This provides a way to interactively display the coordinates and data values of a plot as the cursor moves across it. This functionality is particularly useful for exploring data points or obtaining specific information from plots interactively.
Key Features of Cursor Widget
The following are the key features of cursor widgets of the matplotlb library.
Interactive Cursor − The Cursor class creates an interactive cursor that tracks the position of the mouse pointer as it moves over a Matplotlib plot.
Coordinate Display − When the cursor hovers over the plot the widget displays the x and y coordinates in data coordinates which corresponds to the cursor's position.
Data Value Display − Optionally we can configure the cursor to show the data value or other relevant information at the cursor position which is useful for visualizing specific data points.
Basic Workflow with Cursor Widget
The following is the basic flowchart of the cursor widget usage.
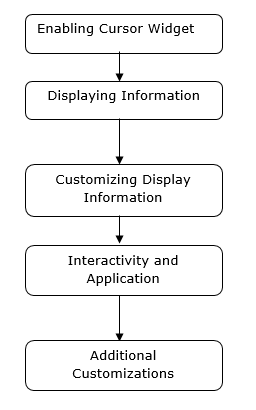
Enable Cursor Widget
For enabling the cursor widget in Matplotlib involves connecting a function to the 'motion_notify_event' using plt.connect() to handle cursor movements over the plot.
This setup allows us to interactively view the cursor's coordinates in the console as we move it over the plot. We can modify the function on_move() to perform other actions or display information in different ways based on our specific requirements.
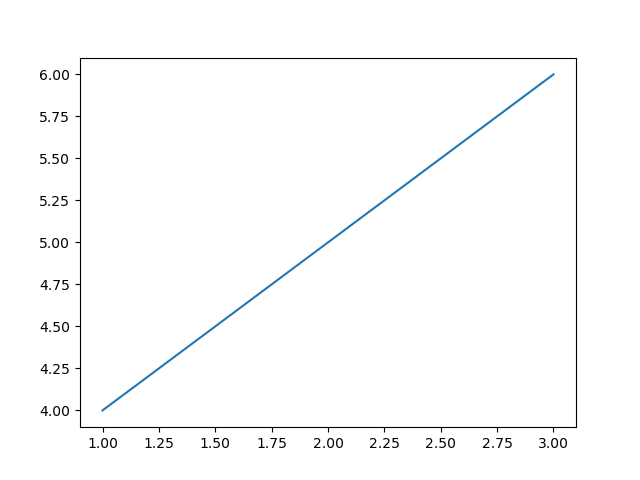
Example
In this example on_move() is a function that handles the cursor movement event. It checks if the cursor is within the plot area event.inaxes and retrieves the cursor's x and y coordinates event.xdata and event.ydata. And the plt.connect('motion_notify_event', on_move) connects the 'motion_notify_event' to the on_move() function which enables the cursor widget. When the cursor moves over the plot the on_move() function gets triggered.
import matplotlib.pyplot as plt
# Function to handle cursor movement
def on_move(event):
   if event.inaxes:  # Check if the cursor is within the plot area
      x, y = event.xdata, event.ydata  # Get cursor position
      print(f'Cursor at x={x:.2f}, y={y:.2f}')  # Display coordinates
# Creating a plot
fig, ax = plt.subplots()
ax.plot([1, 2, 3], [4, 5, 6])
# Connecting the 'motion_notify_event' to the function 'on_move'
plt.connect('motion_notify_event', on_move)
plt.show()
Output
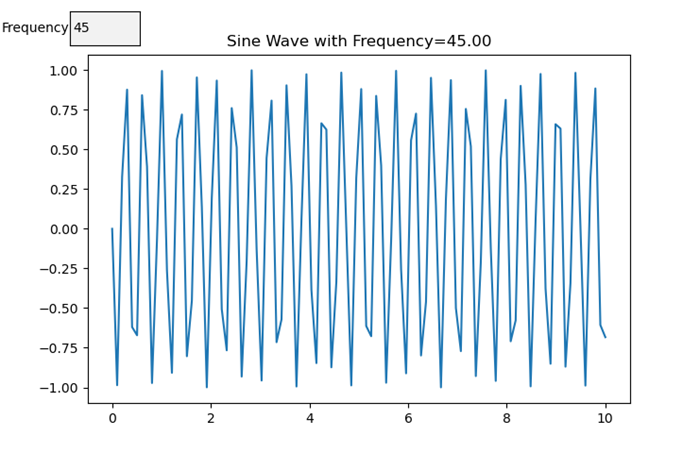
Displaying Information
Displaying information in custom widgets within Matplotlib allows us to create interactive plots with customized elements to showcase specific information or enhance user interaction. Let's create a simple example. In this we are setting the frequency to 45.
Example
import matplotlib.pyplot as plt
from matplotlib.widgets import TextBox, Button
import numpy as np
# Generate sample data
x = np.linspace(0, 10, 100)
y = np.sin(x)
# Create a plot
fig, ax = plt.subplots()
line, = ax.plot(x, y)
# Function to update the plot based on input
def update(text):
   frequency = float(text)  # Get the frequency value from the input
   new_y = np.sin(frequency * x)  # Generate new y values based on frequency
   line.set_ydata(new_y)  # Update the plot
   ax.set_title(f'Sine Wave with Frequency={frequency:.2f}')  # Update plot title
   fig.canvas.draw_idle()  # Redraw the plot
# Create a textbox widget for input
text_box = TextBox(plt.axes([0.1, 0.9, 0.1, 0.075]), 'Frequency')
text_box.on_submit(update)  # Connect the textbox to the update function
# Display the plot
plt.show()
Output
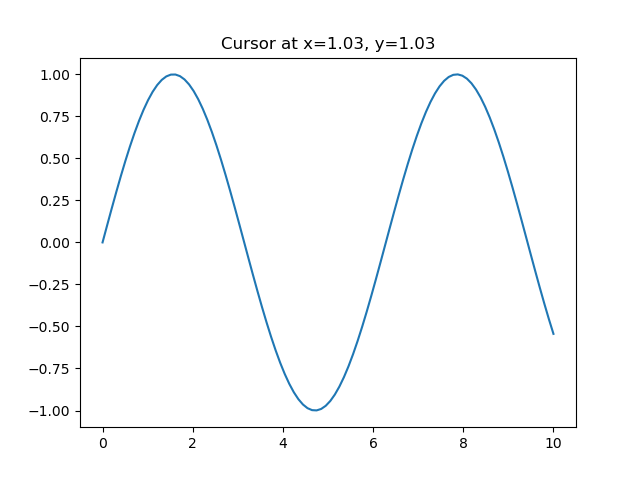
Customizing Display Information
When using cursor widgets in Matplotlib we can customize the information displayed based on the cursor's position on the plot. Here's an example of how we can achieve it.
Example
import matplotlib.pyplot as plt
import numpy as np
# Generating sample data
x = np.linspace(0, 10, 100)
y = np.sin(x)
# Creating a plot
fig, ax = plt.subplots()
line, = ax.plot(x, y)
# Function to update displayed information based on cursor position
def update_cursor_info(event):
   if event.inaxes:
      x_cursor, y_cursor = event.xdata, event.ydata
      ax.set_title(f'Cursor at x={x_cursor:.2f}, y={y_cursor:.2f}')
      fig.canvas.draw_idle()
# Connecting the 'motion_notify_event' to update_cursor_info function
plt.connect('motion_notify_event', update_cursor_info)
plt.show()
Output
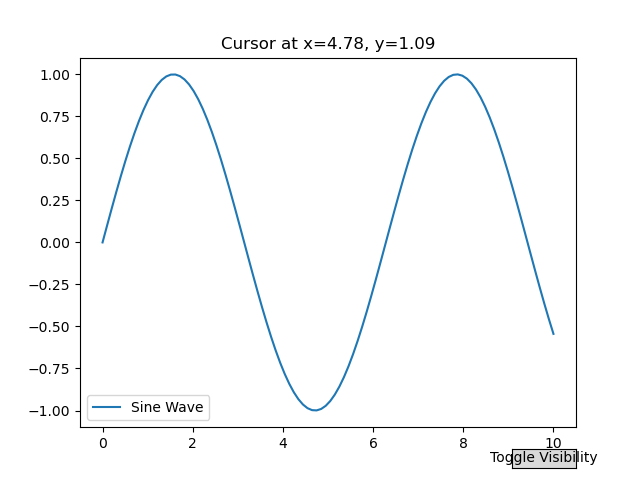
Interactivity and Application
Interactivity in cursor widgets provides a powerful way to enhance user engagement with plots. By using cursor widgets in which users can interactively explore data points and gain insights. Let's enhance the previous example to demonstrate interactivity and potential applications.
Example
import matplotlib.pyplot as plt
import numpy as np
# Generating sample data
x = np.linspace(0, 10, 100)
y = np.sin(x)
# Creating a plot
fig, ax = plt.subplots()
line, = ax.plot(x, y, label='Sine Wave')
# Function to update displayed information based on cursor position
def update_cursor_info(event):
   if event.inaxes:
      x_cursor, y_cursor = event.xdata, event.ydata
      ax.set_title(f'Cursor at x={x_cursor:.2f}, y={y_cursor:.2f}')
      fig.canvas.draw_idle()
# Connecting the 'motion_notify_event' to update_cursor_info function
plt.connect('motion_notify_event', update_cursor_info)
# Adding a legend
ax.legend()
# Adding interactivity with a button to toggle visibility of the sine wave
def toggle_visibility(event):
   current_visibility = line.get_visible()
   line.set_visible(not current_visibility)
   ax.legend().set_visible(not current_visibility)
   fig.canvas.draw_idle()
# Creating a button widget
button_ax = plt.axes([0.8, 0.025, 0.1, 0.04])
toggle_button = plt.Button(button_ax, 'Toggle Visibility')
toggle_button.on_clicked(toggle_visibility)
plt.show()
Output
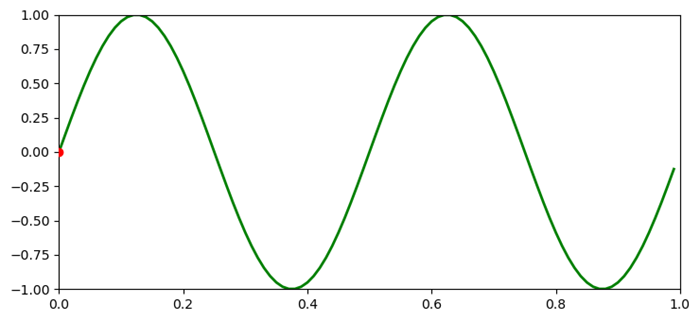
Add a cursor to a curve
In this example we add a cursor to a curve in Matplotlib
Example
import matplotlib.pyplot as plt
import numpy as np

plt.rcParams["figure.figsize"] = [7.50, 3.50]
plt.rcParams["figure.autolayout"] = True

class CursorClass(object):
   def __init__(self, ax, x, y):
      self.ax = ax
      self.ly = ax.axvline(color='yellow', alpha=0.5)
      self.marker, = ax.plot([0], [0], marker="o", color="red", zorder=3)
      self.x = x
      self.y = y
      self.txt = ax.text(0.7, 0.9, '')

   def mouse_event(self, event):
      if event.inaxes:
         x, y = event.xdata, event.ydata
         indx = np.searchsorted(self.x, [x])[0]
         x = self.x[indx]
         y = self.y[indx]
         self.ly.set_xdata(x)
         self.marker.set_data([x], [y])
         self.txt.set_text('x=%1.2f, y=%1.2f' % (x, y))
         self.txt.set_position((x, y))
         self.ax.figure.canvas.draw_idle()
      else:
         return

t = np.arange(0.0, 1.0, 0.01)
s = np.sin(2 * 2 * np.pi * t)

fig, ax = plt.subplots()

cursor = CursorClass(ax, t, s)
cid = plt.connect('motion_notify_event', cursor.mouse_event)

ax.plot(t, s, lw=2, color='green')
plt.axis([0, 1, -1, 1])

plt.show()
Output
To Continue Learning Please Login