- Matplotlib Basics
- Matplotlib - Home
- Matplotlib - Introduction
- Matplotlib - Vs Seaborn
- Matplotlib - Environment Setup
- Matplotlib - Anaconda distribution
- Matplotlib - Jupyter Notebook
- Matplotlib - Pyplot API
- Matplotlib - Simple Plot
- Matplotlib - Saving Figures
- Matplotlib - Markers
- Matplotlib - Figures
- Matplotlib - Styles
- Matplotlib - Legends
- Matplotlib - Colors
- Matplotlib - Colormaps
- Matplotlib - Colormap Normalization
- Matplotlib - Choosing Colormaps
- Matplotlib - Colorbars
- Matplotlib - Text
- Matplotlib - Text properties
- Matplotlib - Subplot Titles
- Matplotlib - Images
- Matplotlib - Image Masking
- Matplotlib - Annotations
- Matplotlib - Arrows
- Matplotlib - Fonts
- Matplotlib - What are Fonts?
- Setting Font Properties Globally
- Matplotlib - Font Indexing
- Matplotlib - Mathematical Expressions
- Matplotlib - Transforms
- Matplotlib - Ticks and Tick Labels
- Matplotlib - Axis Ranges
- Matplotlib - Axis Scales
- Matplotlib - Axis Ticks
- Matplotlib - Formatting Axes
- Matplotlib - Axes Class
- Matplotlib - Twin Axes
- Matplotlib - Figure Class
- Matplotlib - Multiplots
- Matplotlib - Grids
- Matplotlib - Object-oriented Interface
- Matplotlib - PyLab module
- Matplotlib - Subplots() Function
- Matplotlib - Subplot2grid() Function
- Matplotlib - Anchored Artists
- Matplotlib - Manual Contour
- Matplotlib - Coords Report
- Matplotlib - AGG filter
- Matplotlib - Ribbon Box
- Matplotlib - Fill Spiral
- Matplotlib - Findobj Demo
- Matplotlib - Hyperlinks
- Matplotlib - Image Thumbnail
- Matplotlib - Plotting with Keywords
- Matplotlib - Create Logo
- Matplotlib - Multipage PDF
- Matplotlib - Multiprocessing
- Matplotlib - Print Stdout
- Matplotlib - Compound Path
- Matplotlib - Sankey Class
- Matplotlib - MRI with EEG
- Matplotlib - Stylesheets
- Matplotlib - Background Colors
- Matplotlib - Basemap
- Matplotlib Event Handling
- Matplotlib - Event Handling
- Matplotlib - Close Event
- Matplotlib - Mouse Move
- Matplotlib - Click Events
- Matplotlib - Scroll Event
- Matplotlib - Keypress Event
- Matplotlib - Pick Event
- Matplotlib - Looking Glass
- Matplotlib - Path Editor
- Matplotlib - Poly Editor
- Matplotlib - Timers
- Matplotlib - Viewlims
- Matplotlib - Zoom Window
- Matplotlib Plotting
- Matplotlib - Bar Graphs
- Matplotlib - Histogram
- Matplotlib - Pie Chart
- Matplotlib - Scatter Plot
- Matplotlib - Box Plot
- Matplotlib - Violin Plot
- Matplotlib - Contour Plot
- Matplotlib - 3D Plotting
- Matplotlib - 3D Contours
- Matplotlib - 3D Wireframe Plot
- Matplotlib - 3D Surface Plot
- Matplotlib - Quiver Plot
- Matplotlib Useful Resources
- Matplotlib - Quick Guide
- Matplotlib - Useful Resources
- Matplotlib - Discussion
Matplotlib - Mouse Cursor
Introduction
Matplotlib itself does not have a specific Mouse Cursor widget but however Matplotlib library provides various mechanisms to interact with the mouse cursor by allowing developers to enhance the interactivity of plots. Let's explore these aspects in detail.
Developers can leverage these events to enhance the interactivity of plots, track cursor positions and respond to user actions in a customized manner. The ability to change cursor styles further enriches the user experience when exploring data visualizations.
Handling Mouse Events in Matplotlib
Matplotlib provides the mpl_connect function, which allows us to connect callback functions to various events such as mouse events. This functionality enables us to capture mouse movements, clicks and other interactions within our Matplotlib plots.
Matplotlib offers event handling for mouse interactions which allows us to capture mouse-related events such as button clicks, mouse motion and scrolling. This capability is essential for creating interactive plots.
The below are the common mouse events in Matplotlib library let’s see them.
button_press_event and button_release_event
The button_press_event is triggered when a mouse button is pressed and the button_release_event is triggered when a mouse is released. We can use them to capture the state of the mouse buttons.
motion_notify_event
This event is triggered when the mouse is moved. It's useful for tracking the mouse cursor's position and updating the plot accordingly.
scroll_event
This event is triggered when the mouse scroll wheel is used. It allows us to respond to scrolling actions.
Retrieving Cursor Coordinates
To obtain the coordinates of the mouse cursor within a plot we can use the event.xdata and event.ydata attributes which represent the data coordinates corresponding to the cursor position. The motion_notify_event is commonly used for tracking mouse movements.
Displaying Cursor Coordinates
To display the cursor coordinates we can use the two functions on_mouse_move() and fig.canvas.mpl_connect() combinedly.
on_mouse_move(event) − This function is triggered on mouse movement. It checks if the cursor is within the plot event.inaxes and then prints the cursor coordinates.
fig.canvas.mpl_connect('motion_notify_event', on_mouse_move) − This line connects the mouse movement event to the on_mouse_move function.
Example
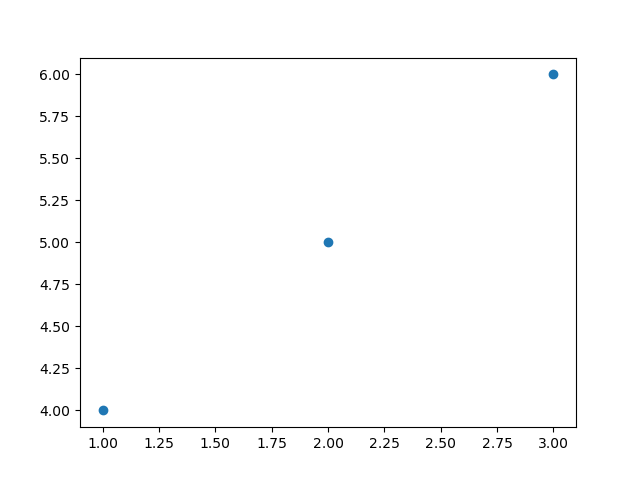
Here in this example we are displaying the cursor coordinates of a matplotlib plot.
import matplotlib.pyplot as plt
# Function to be triggered on mouse movement
def on_mouse_move(event):
   if event.inaxes:
      x_cursor, y_cursor = event.xdata, event.ydata
      print(f"Cursor at x={x_cursor}, y={y_cursor}")
# Creating a figure and axes
fig, ax = plt.subplots()
# Displaying a plot (for illustration)
ax.scatter([1, 2, 3], [4, 5, 6])
# Connecting the mouse movement event to the on_mouse_move function
fig.canvas.mpl_connect('motion_notify_event', on_mouse_move)
plt.show()
Output
Cursor at x=2.2306451612903224, y=5.127380952380952
Cursor at x=2.23508064516129, y=5.127380952380952
Cursor at x=2.23508064516129, y=5.121428571428572
Cursor at x=2.239516129032258, y=5.121428571428572
Cursor at x=2.2439516129032255, y=5.121428571428572
Cursor at x=2.2483870967741932, y=5.121428571428572
Cursor at x=2.2483870967741932, y=5.1154761904761905
Cursor at x=2.2528225806451614, y=5.1154761904761905
Cursor at x=2.257258064516129, y=5.1154761904761905
----------------------------------------------------
----------------------------------------------------
Cursor at x=2.0, y=5.591666666666667
Cursor at x=2.013306451612903, y=5.728571428571429
Cursor at x=2.013306451612903, y=5.817857142857143
Cursor at x=2.013306451612903, y=5.895238095238096
Cursor at x=2.013306451612903, y=5.966666666666667
Cursor at x=2.0044354838709677, y=6.026190476190476
Cursor at x=1.9955645161290323, y=6.085714285714285
Cursor at x=2.9314516129032255, y=4.014285714285714
Responding to Mouse Clicks
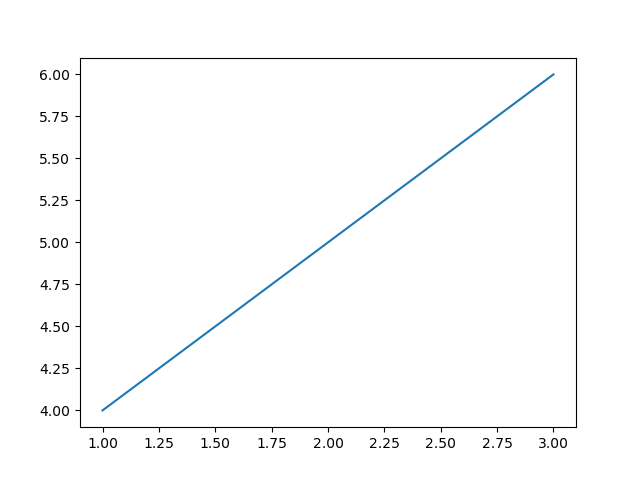
We can also respond to mouse clicks using the button_press_event or button_release_event events.
import matplotlib.pyplot as plt
# Function to be triggered on mouse click
def on_mouse_click(event):
   if event.inaxes:
      x_click, y_click = event.xdata, event.ydata
      print(f"Mouse clicked at x={x_click}, y={y_click}")
# Creating a figure and axes
fig, ax = plt.subplots()
# Displaying a plot (for illustration)
ax.plot([1, 2, 3], [4, 5, 6])
# Connecting the mouse click event to the on_mouse_click function
fig.canvas.mpl_connect('button_press_event', on_mouse_click)
plt.show()
Output
Mouse clicked at x=0.9975806451612903, y=4.002380952380952
Mouse clicked at x=0.9354838709677418, y=5.9904761904761905
Creating Custom Mouse Cursors
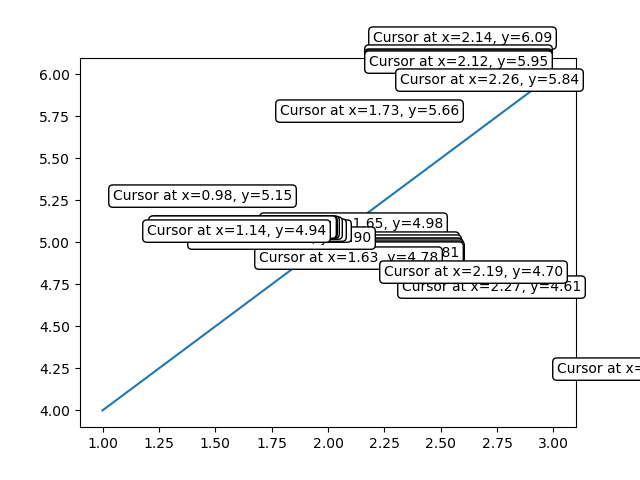
While Matplotlib doesn't provide a specific Mouse Cursor widget we can create custom visualizations or annotations at the cursor position to simulate a cursor effect. For instance we can use the annotate function to display information dynamically as the cursor moves.
Example
In this example the annotate() function is used to dynamically display cursor coordinates as the mouse moves. The plt.draw() method is called to update the plot in real-time.
import matplotlib.pyplot as plt
# Function to be triggered on mouse movement
def on_mouse_move(event):
   if event.inaxes:
      x_cursor, y_cursor = event.xdata, event.ydata
      ax.annotate(f'Cursor at x={x_cursor:.2f}, y={y_cursor:.2f}',
         xy=(x_cursor, y_cursor), xytext=(10, 10),
         textcoords='offset points', ha='left', va='bottom',
         bbox=dict(boxstyle='round,pad=0.3', edgecolor='black', facecolor='white'))
      plt.draw()
# Creating a figure and axes
fig, ax = plt.subplots()
# Displaying a plot (for illustration)
ax.plot([1, 2, 3], [4, 5, 6])
# Connecting the mouse movement event to the on_mouse_move function
fig.canvas.mpl_connect('motion_notify_event', on_mouse_move)
plt.show()
Output
Use Cases
The following are the use cases of the mouse widgets.
Interactive Data Exploration − Tracking the mouse cursor position allows users to interactively explore data points on a plot.
Coordinate Selection − By capturing mouse clicks we can enable users to select specific coordinates or regions of interest.
Custom Interactions − Utilizing mouse events we can implement custom interactions based on user actions such as highlighting data points or triggering specific functions.
To Continue Learning Please Login